- July 3, 2024
- Posted by: admin
- Category: BitCoin, Blockchain, Cryptocurrency, Investments
Onchain Highlights
DEFINITION: Realized volatility is the standard deviation of returns from the mean return of a market. High values in realized volatility indicate a high-risk phase in that market. It is measured on log returns over a fixed time horizon or a rolling window to obtain a time-dependent observable. While implied volatility refers to the market’s assessment of future volatility, realized volatility measures what happened in the past.
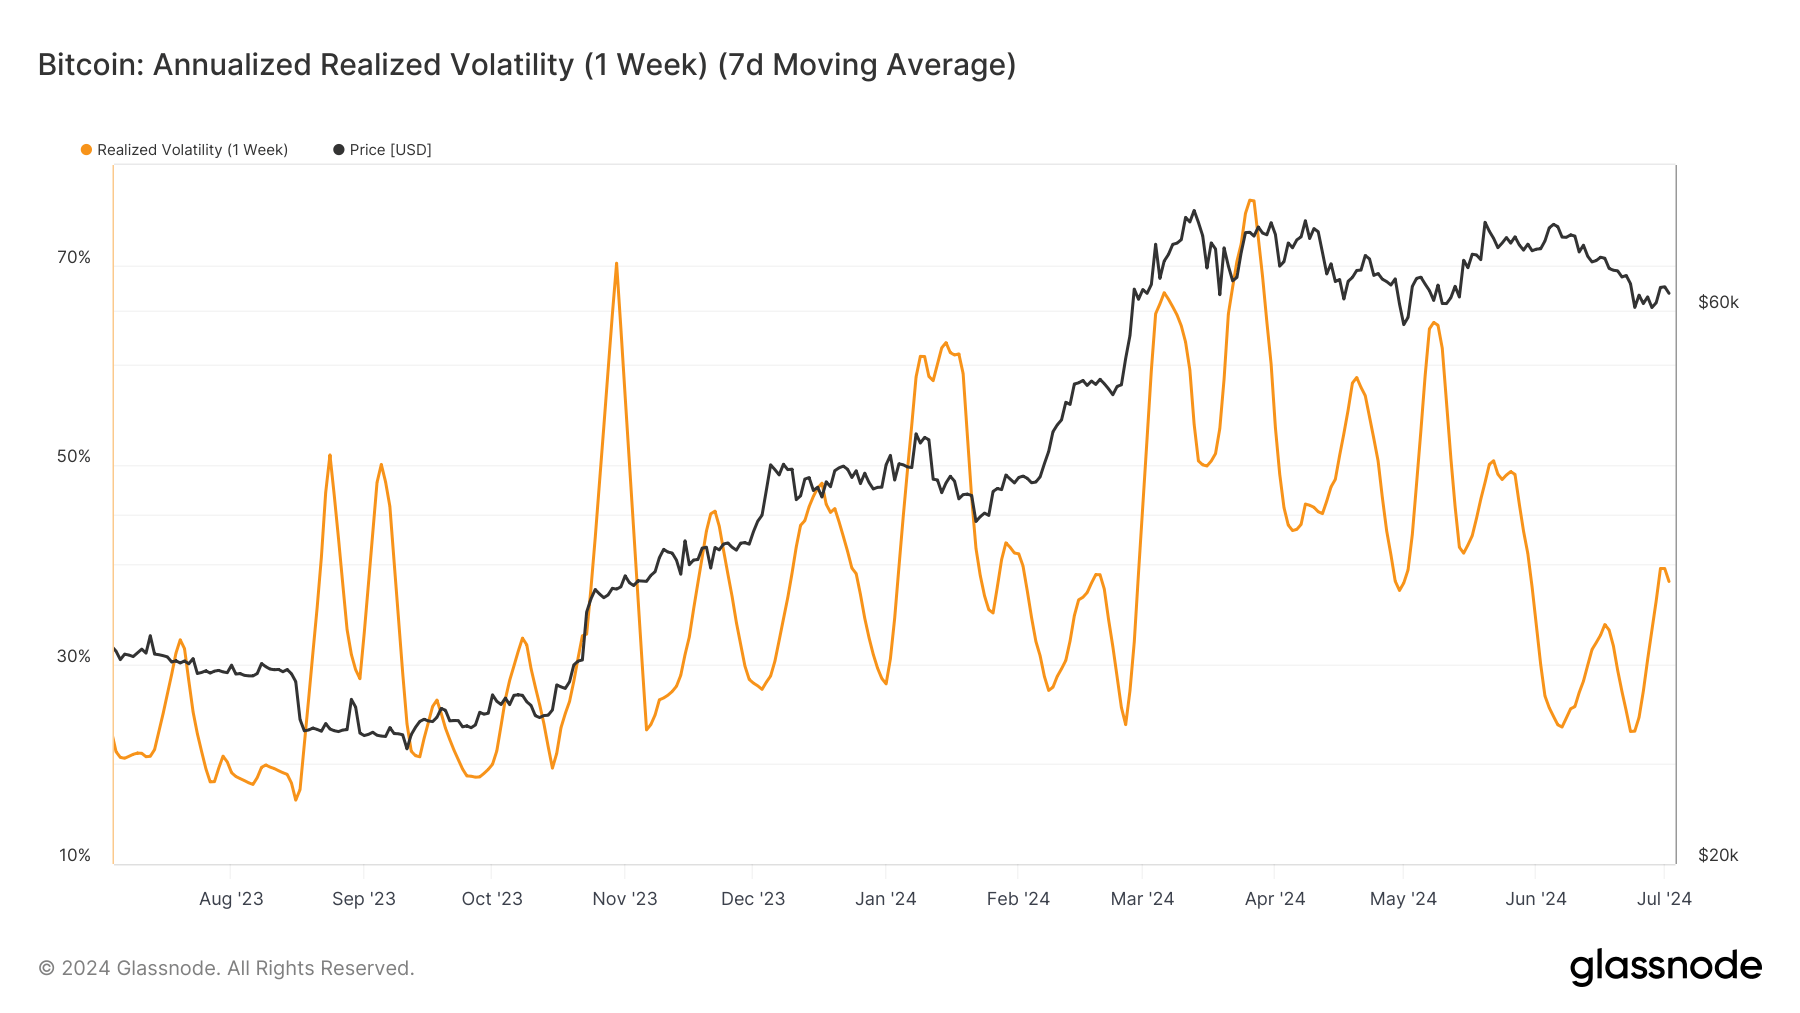
Bitcoin’s annualized realized volatility has fluctuated throughout 2024, reflecting significant market movements and reactions. Early in the year, volatility peaked at over 70% as Bitcoin’s price approached $73,000.
Following this, volatility and price showed a pattern: a price correction while realized volatility saw a significant decline, bottoming near 20% by late June. This suggests periods of relative calm in the market despite Bitcoin maintaining its value around $60,000.

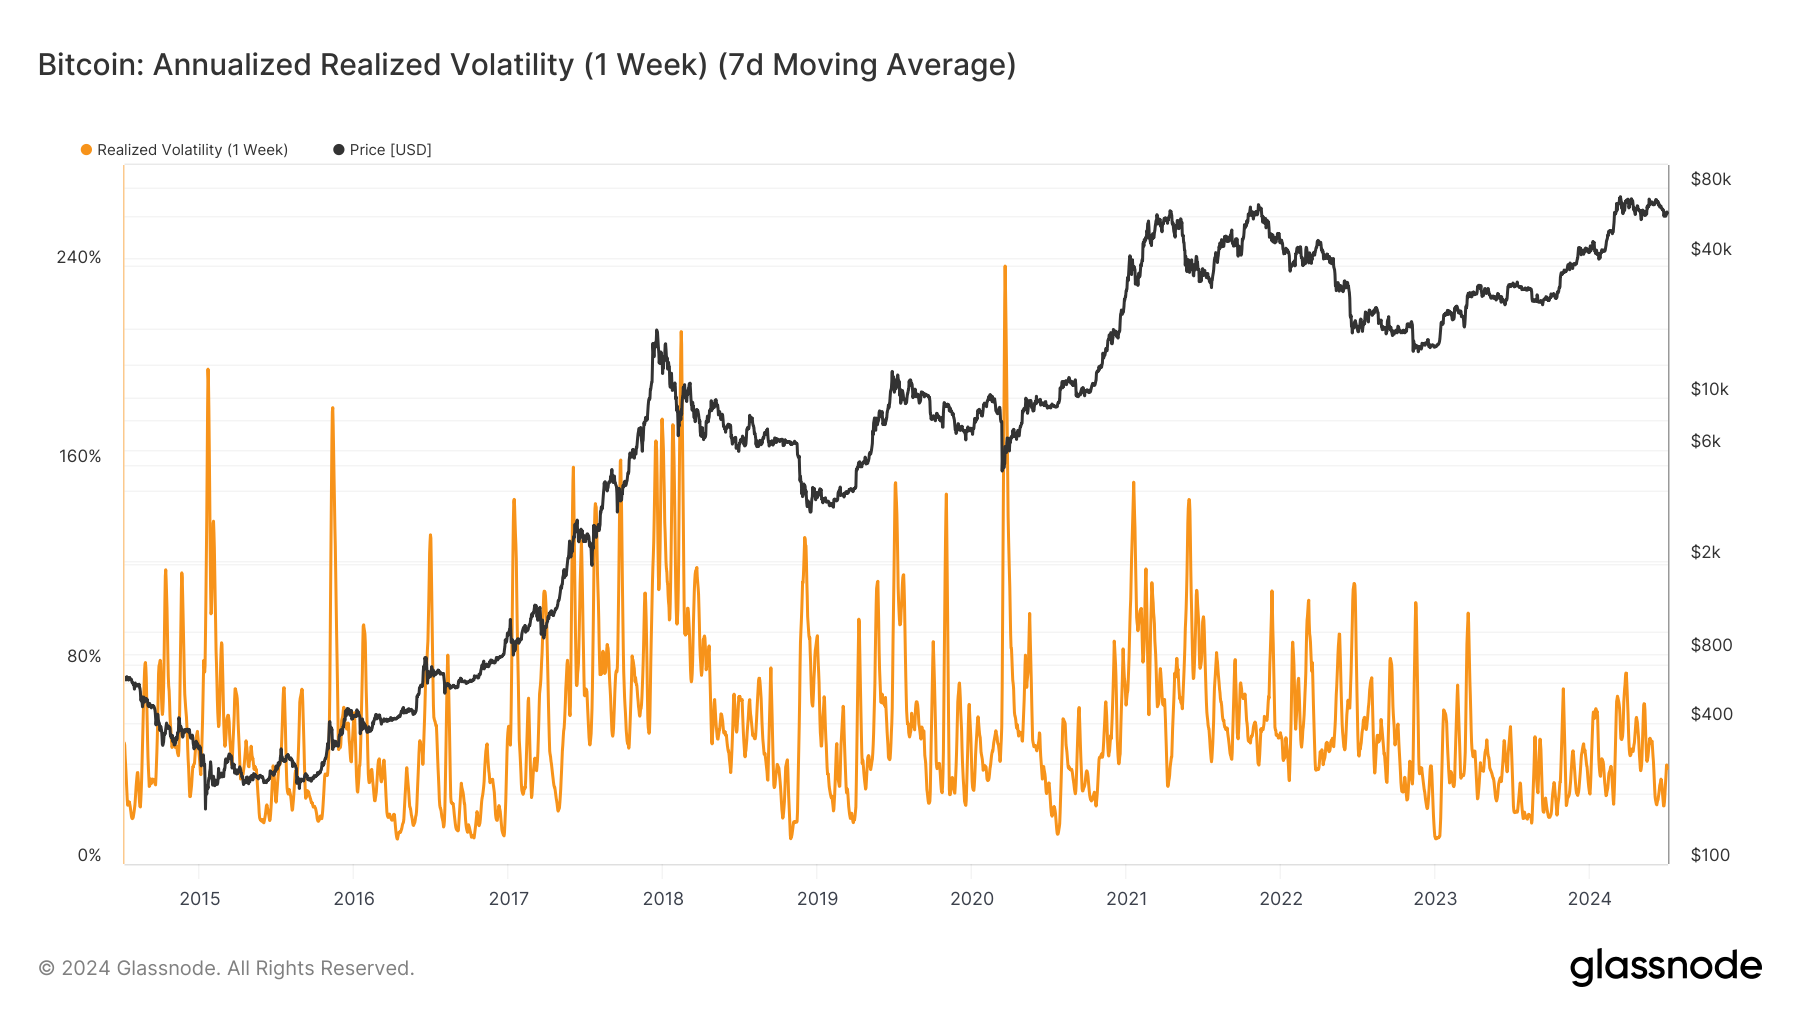
Historical data indicates that Bitcoin’s volatility often spikes during price surges or sharp declines. For instance, the long-term chart highlights notable volatility peaks corresponding with Bitcoin’s major price movements over the past decade, including the bull run of late 2017 and the sharp corrections in subsequent years. The data highlights the asset’s characteristic volatility, which remains a critical factor for traders and investors.
Bitcoin’s current lower volatility phase may indicate a market maturation or a temporary pause in market activity. However, past trends suggest that periods of low volatility are often followed by significant price movements, keeping market participants alert for potential shifts.

The post Low Bitcoin volatility marks potential market maturation amid steady prices appeared first on CryptoSlate.
