- May 11, 2023
- Posted by: admin
- Category: BitCoin, Blockchain, Cryptocurrency, Investments
The Bitcoin network has seen a record number of transactions since the beginning of the month, reaching an all-time high of 682,099 on May 1. The previous ATH of 490,459 was recorded during the 2017 bull run — just before BTC reached $20,000 at the end of December.
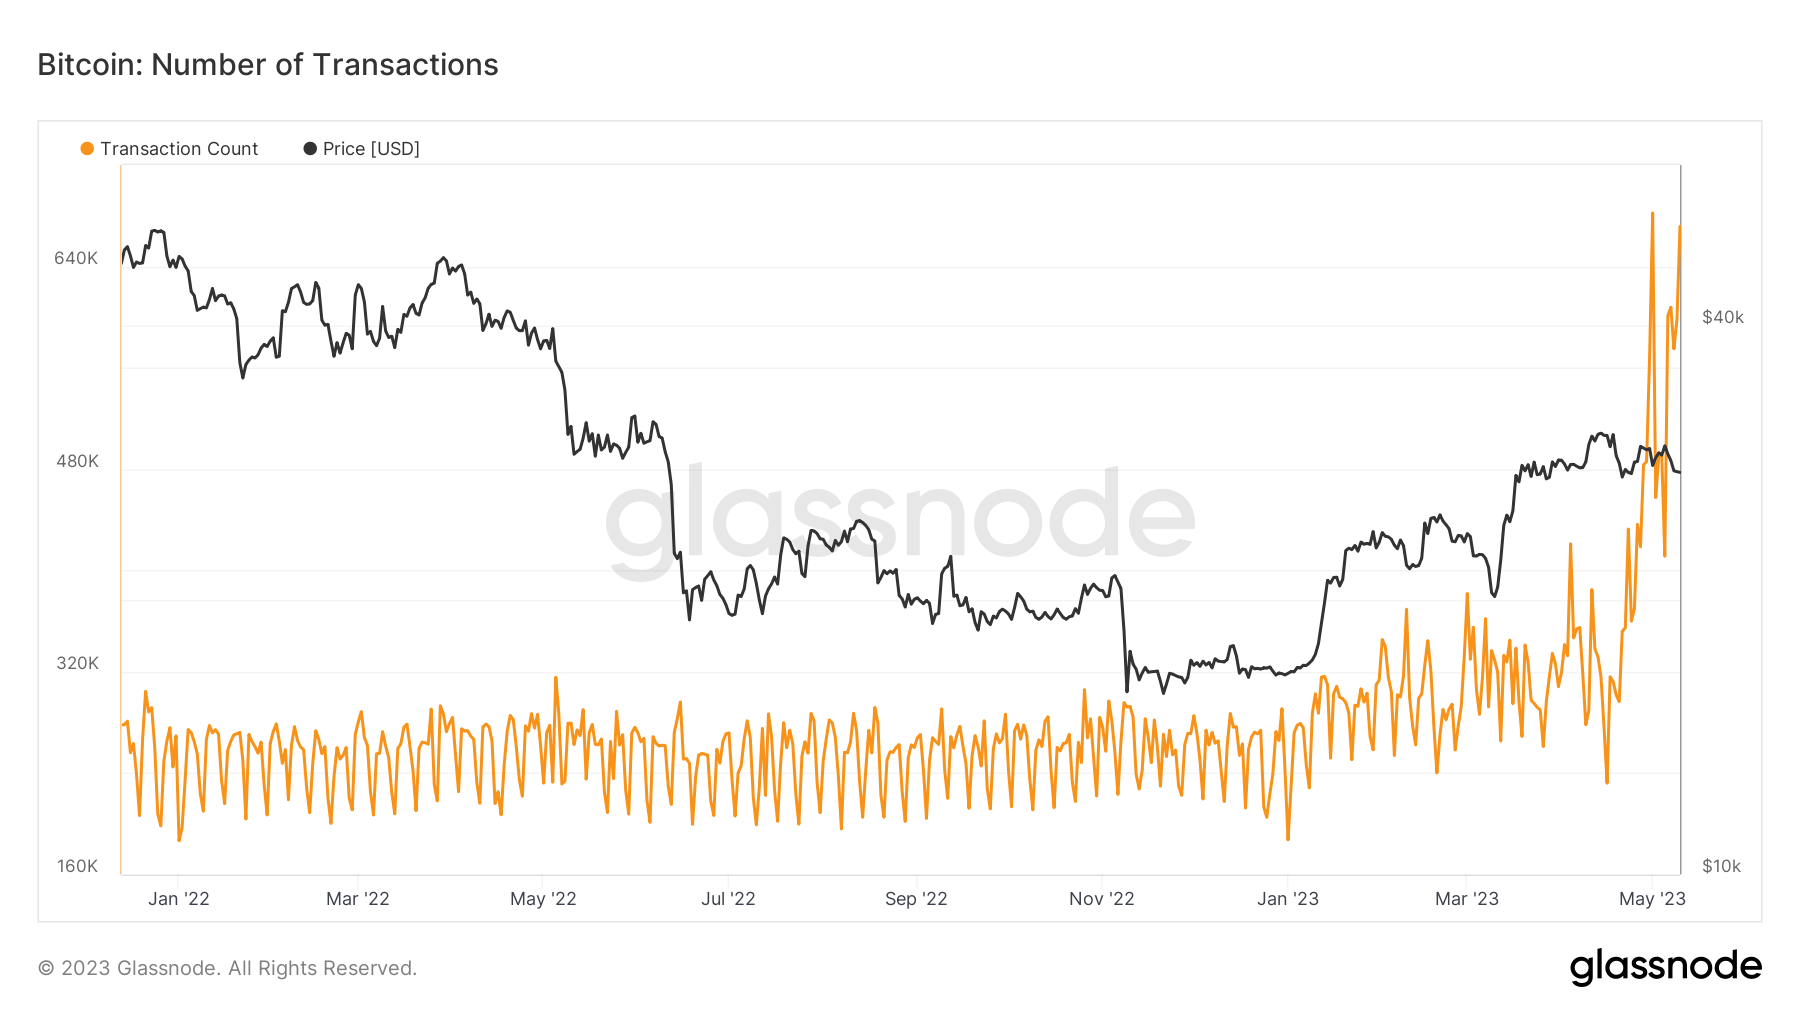
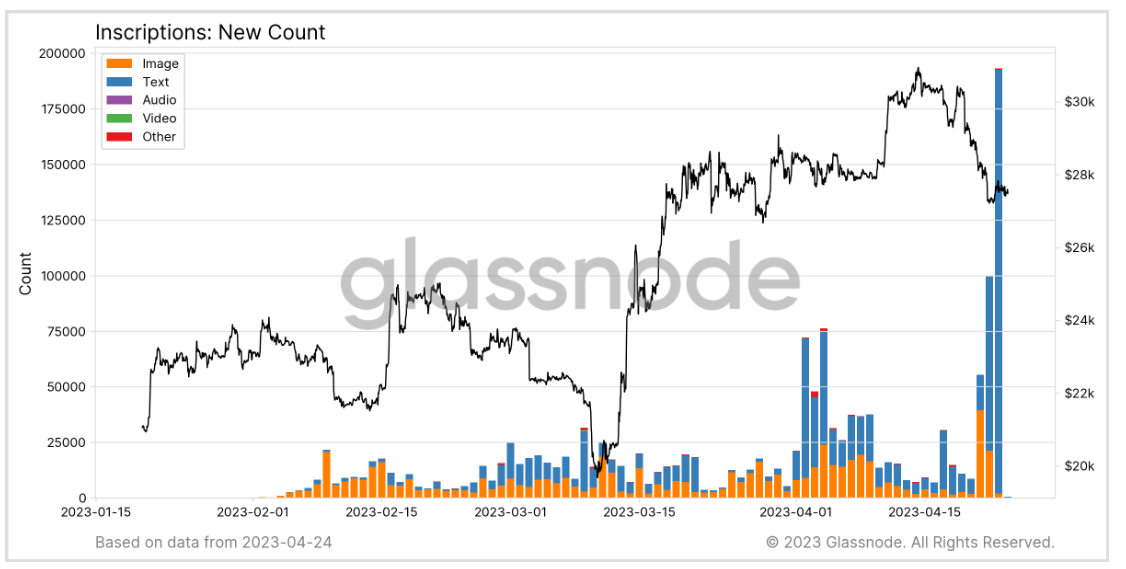
This historical spike in transactions resulted from the rising popularity of Bitcoin Ordinal Inscriptions, digital assets similar to NFTs inscribed on a satoshi, Bitcoin’s lowest denomination. The total number of inscriptions reached 5 million at the end of April, with over 200,000 created in a single day.
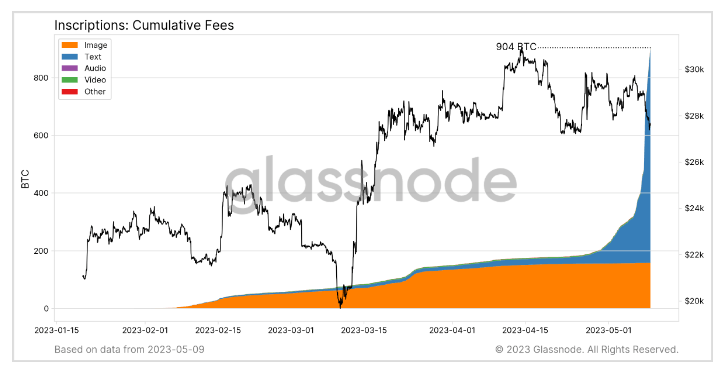
Since the introduction of the Bitcoin Ordinals protocol, inscriptions have generated 904 BTC in fees for Bitcoin miners.
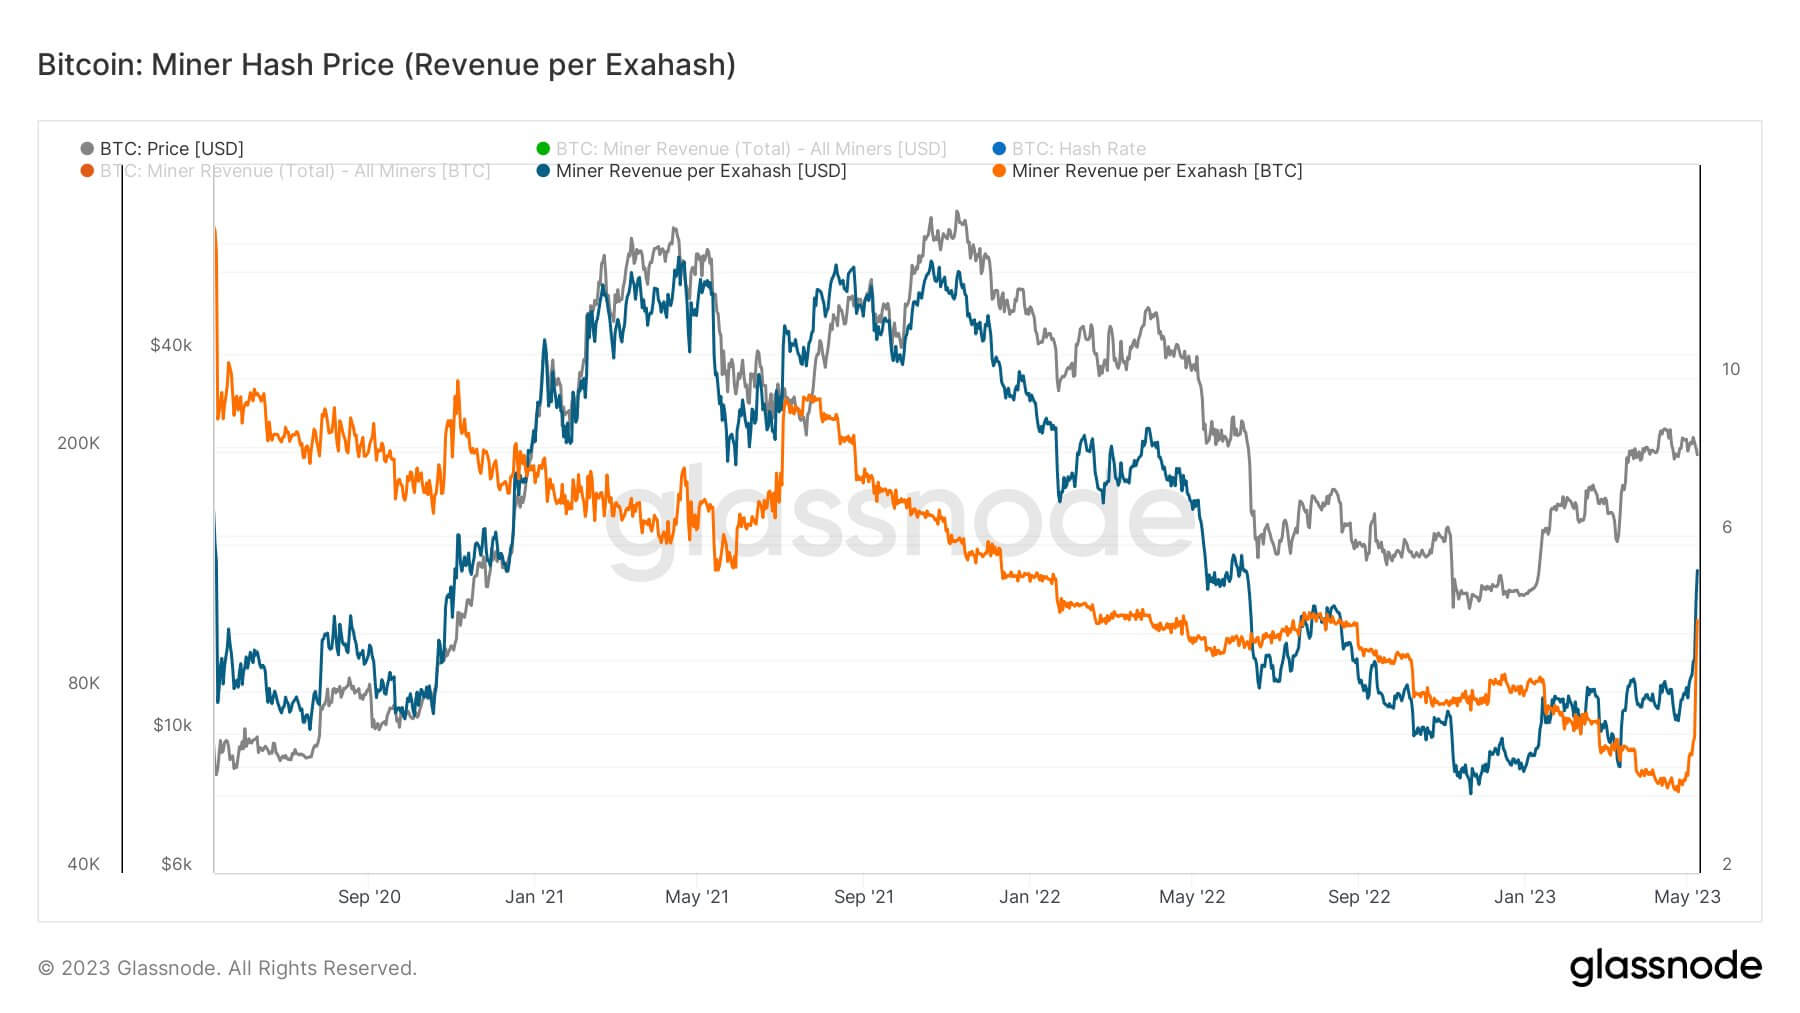
While inscriptions have generated quite a bit of controversy among the Bitcoin community, they have benefited miners hugely. During the past six months, low BTC prices have driven many large mining operations to the verge of profitability. Mining rewards weren’t enough to sustain operations — with several large miners forced to declare bankruptcy or take on additional loans.
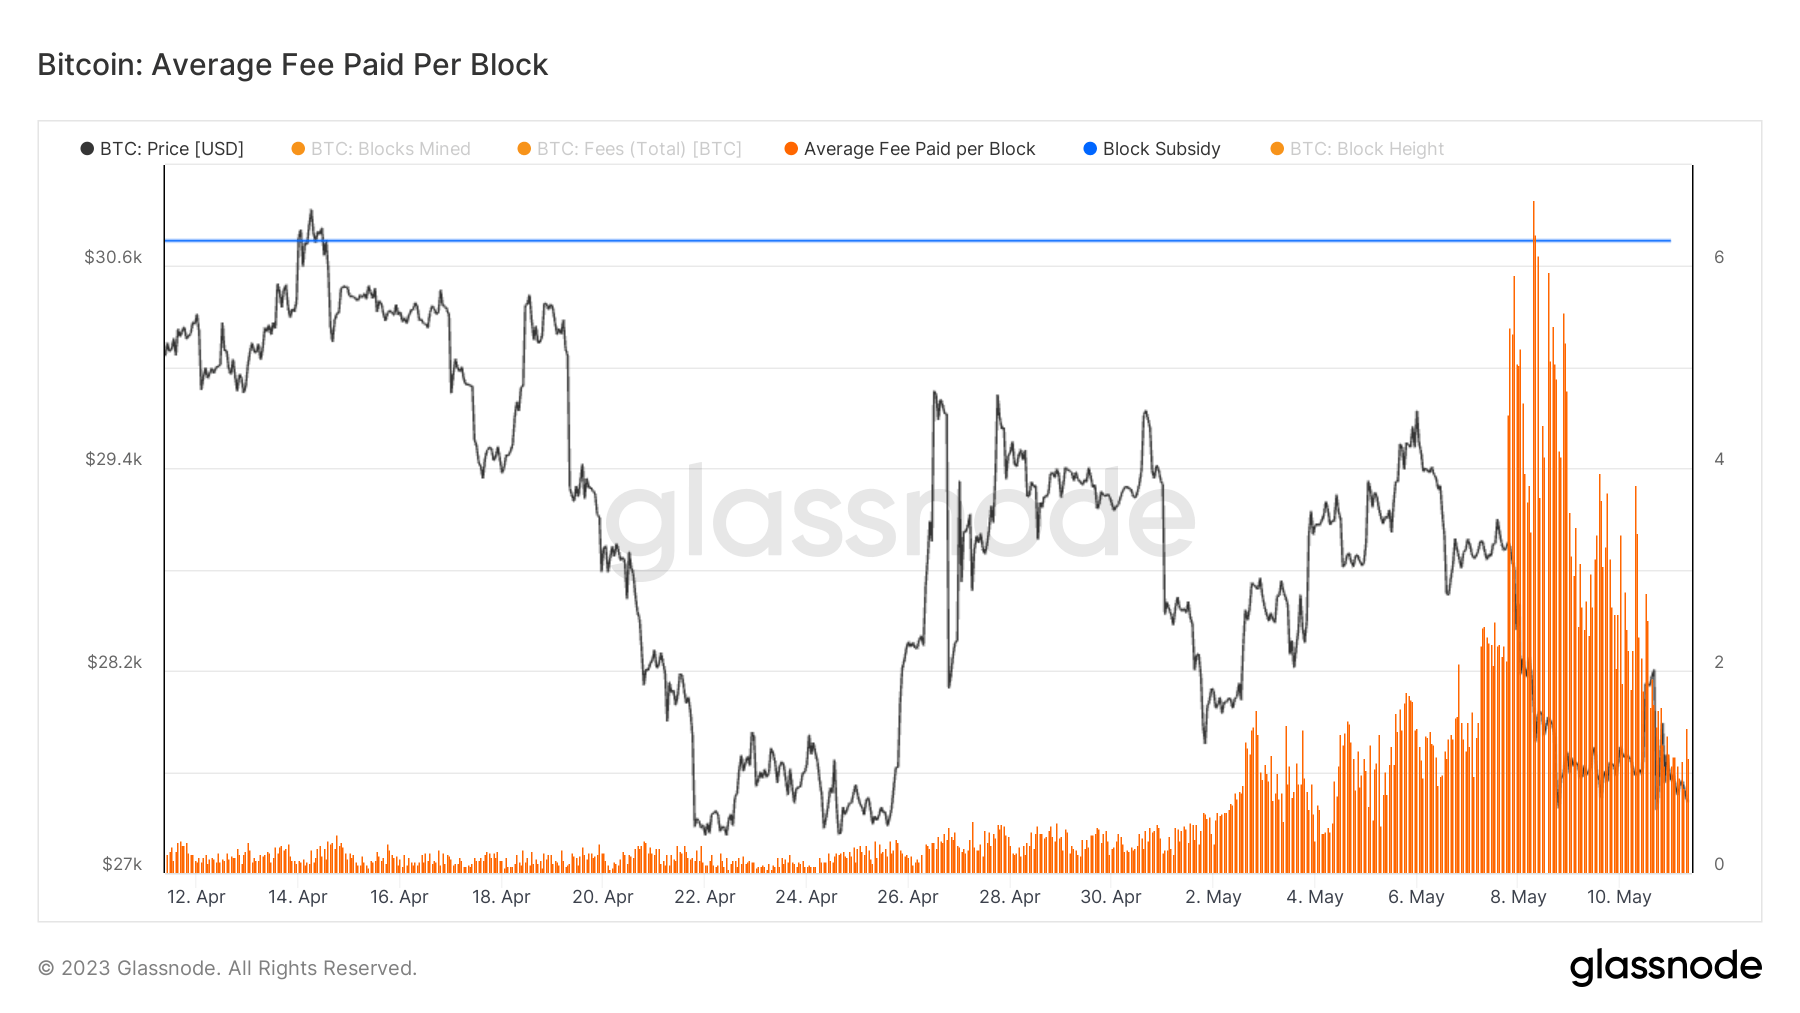
Miners have seen record profits since the beginning of May, almost exclusively due to the increase in BTC fees. Miner revenue per exahash, denominated in BTC and USD, has skyrocketed in the past week — returning to levels seen in September 2021.
However, the ever-growing number of inscriptions wasn’t indicative of an overall growth in network activity on Bitcoin.
Data analyzed by CryptoSlate revealed a negative correlation between the number of Bitcoin transactions and the number of active addresses. The rise of BRC-20 tokens hasn’t increased the number of active addresses, indicating notable stagnation in activity.
According to data from Glassnode, May 7 saw an almost vertical drop in the number of active addresses — dropping to a two-year low of 566,000.
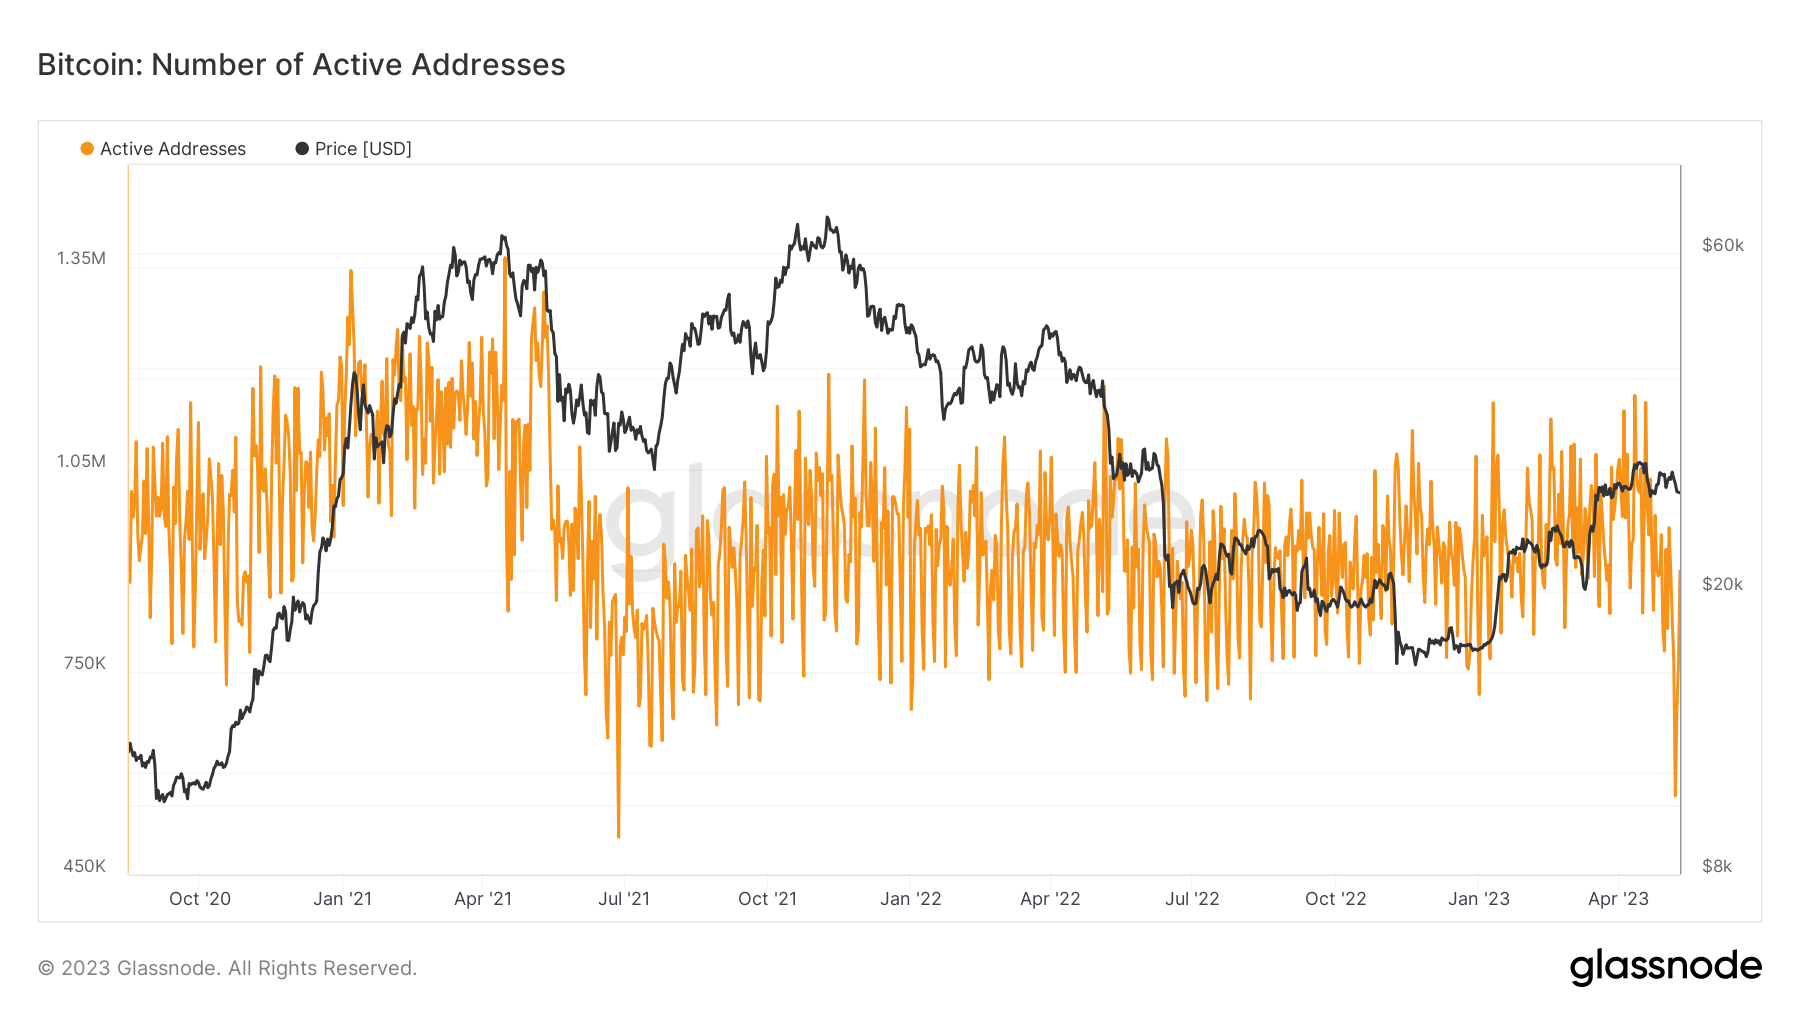
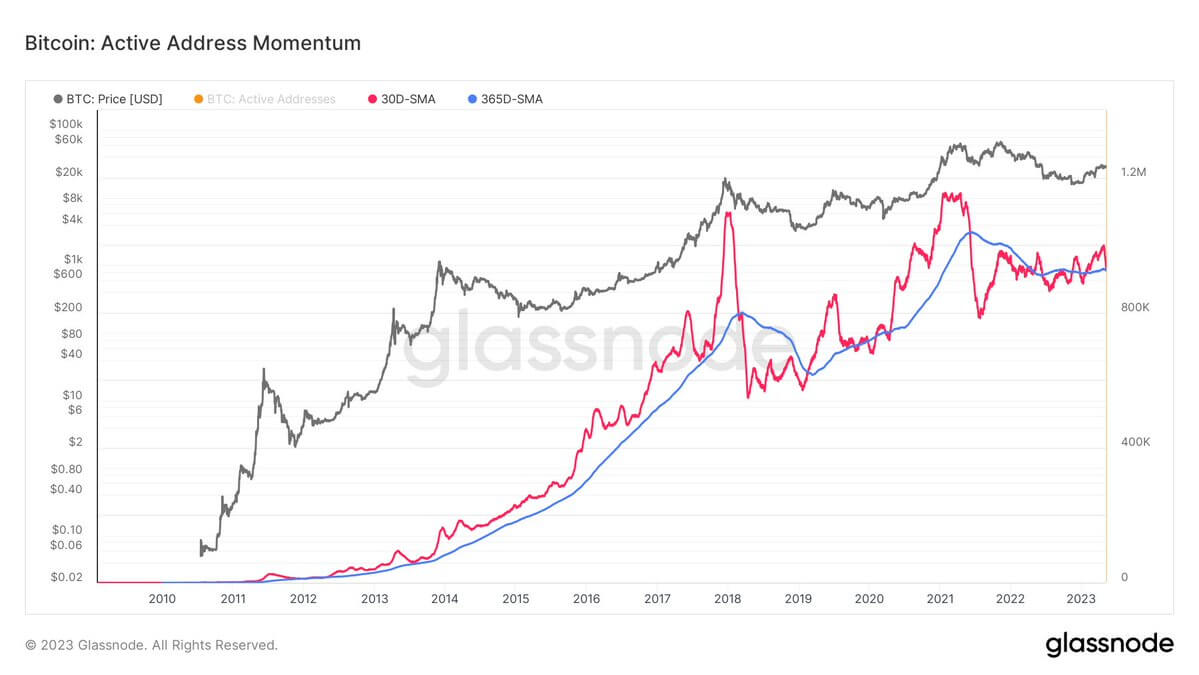
Diving deeper into active addresses reveals that the drop isn’t an acute deviation but a month-long trend. The 30-day SMA has dropped below the 365-day SMA, showing that the average number of active addresses in the past month has fallen below the yearly average.
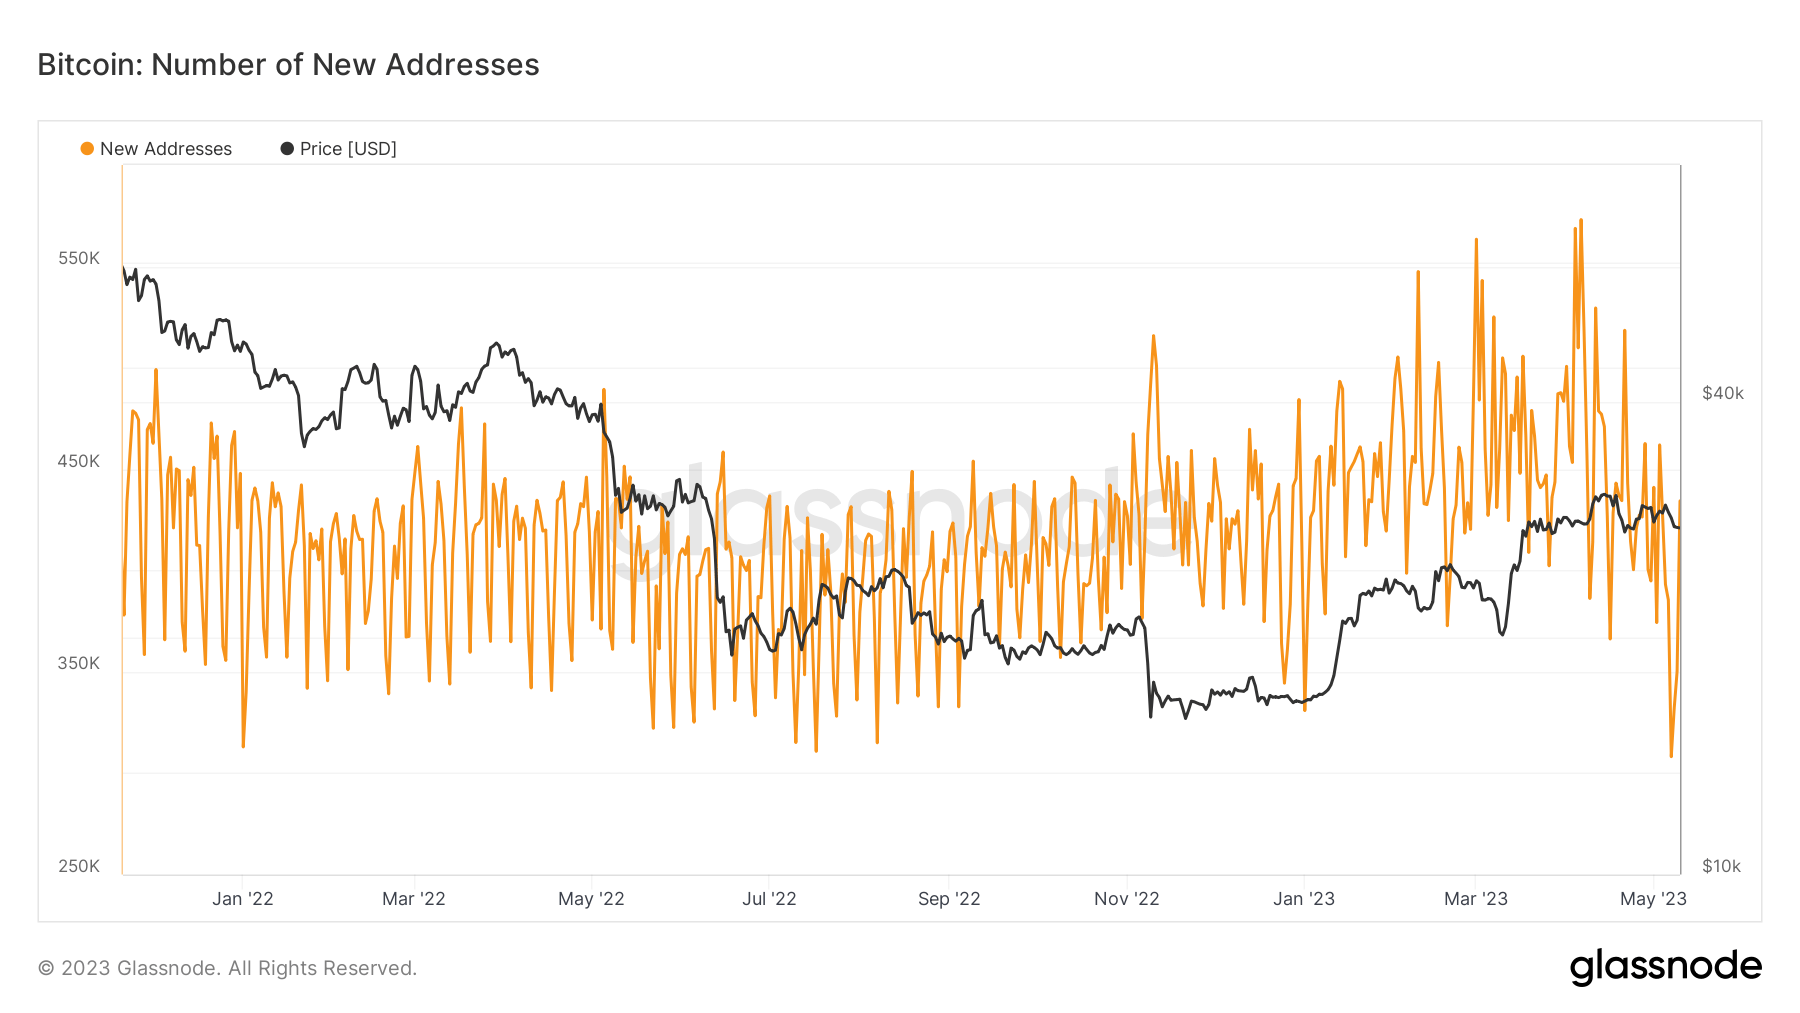
The number of new addresses has also taken a nosedive, with the number of unique addresses that appeared for the first time in a transaction dropping to 308,000 on May 7.
CryptoSlate analysis also found an inversion in the 30-day SMA and 365-day SMA of new addresses. This further confirms the trend of declining activity.
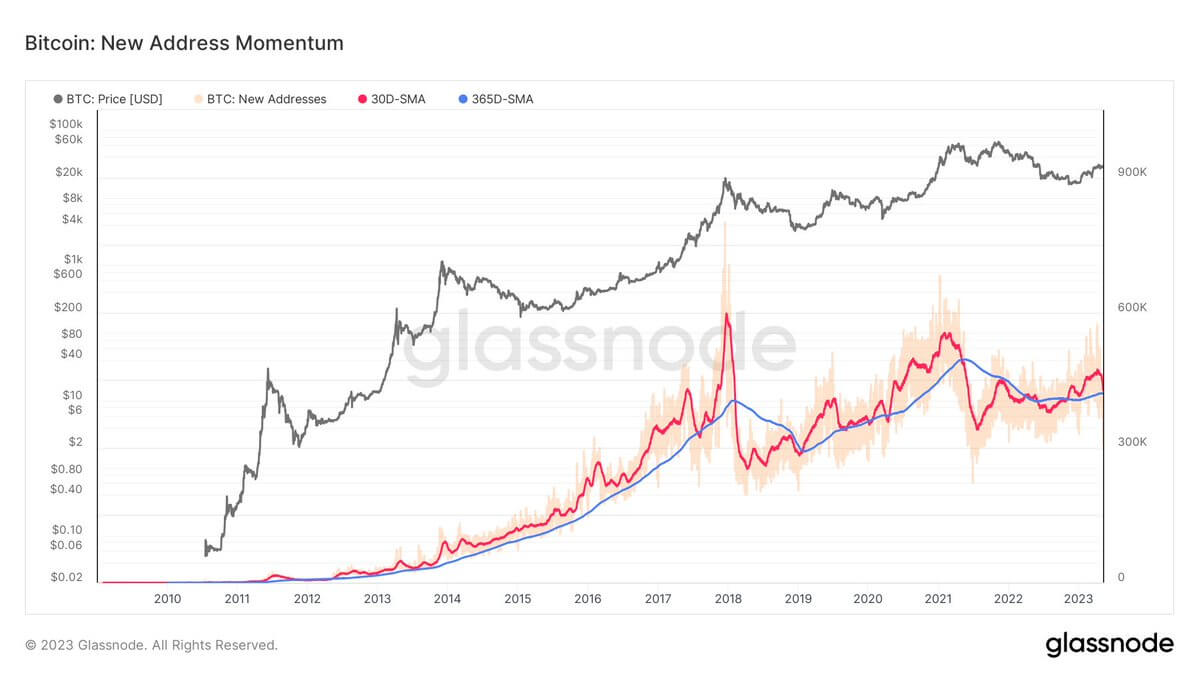
And while this isn’t the first time the market has seen such inversions, it’s the first time it showed a negative correlation to the number of transactions. This discrepancy has fueled criticism from the Bitcoin community, arguing that inscriptions were “spamming” the network and keeping ordinary users away.
Transaction fees have returned to their standard lows ranging from $0.46 to $2.30, down from the $5 highs they experienced at the beginning of the month. However, the total number of transactions waiting in the mempool stood at over 303,000 on May 11. This drastically increased settlement times for low and medium-priority transactions.

It’s unlikely that this discrepancy will continue. The demand for Bitcoin Ordinals already saw a drop and is bound to decrease even further in the coming months. The average fees paid per block have been decreasing and are bound to return to their April levels in the coming week.
On-chain data seems to indicate that the sharp rise in popularity Bitcoin Ordinals saw in the past month most likely won’t last. The novelty of the asset class quickly created a fad that wreaked havoc on the Bitcoin network and caused a stir in the Bitcoin community. We are yet to see whether the interest in inscriptions manages to survive future price volatility.
The post Research: Bitcoin Inscriptions might have run their course appeared first on CryptoSlate.
