- July 21, 2023
- Posted by: admin
- Category: BitCoin, Blockchain, Cryptocurrency, Investments
Data shows the Bitcoin halving is only approximately 280 days away now. Here’s what the previous cycles looked like at the same point.
Next Bitcoin Halving Is Only Around 280 Days Away Now
The “halving” refers to a periodic event where Bitcoin’s block rewards are permanently cut in half. The block rewards are what miners receive as compensation for solving blocks on the network.
This event takes place every four years, with the next one being scheduled to take place sometime next year. The exact estimates differ between different mining-related platforms, but in the context of the current discussion, the next halving is assumed to be taking place in about 280 days.
Historically, halvings have held immense importance for the cryptocurrency, as the block rewards are essentially the only way to mint more of the coin, so their being cut in half tightens the production rate of the asset, and hence, makes it more scarce.
The height of bull markets in the past has always occurred following the halvings, as these events come with a strong bullish narrative. Because of their significance, the halvings are often chosen as the start and end points for defining what constitutes a Bitcoin “cycle.”
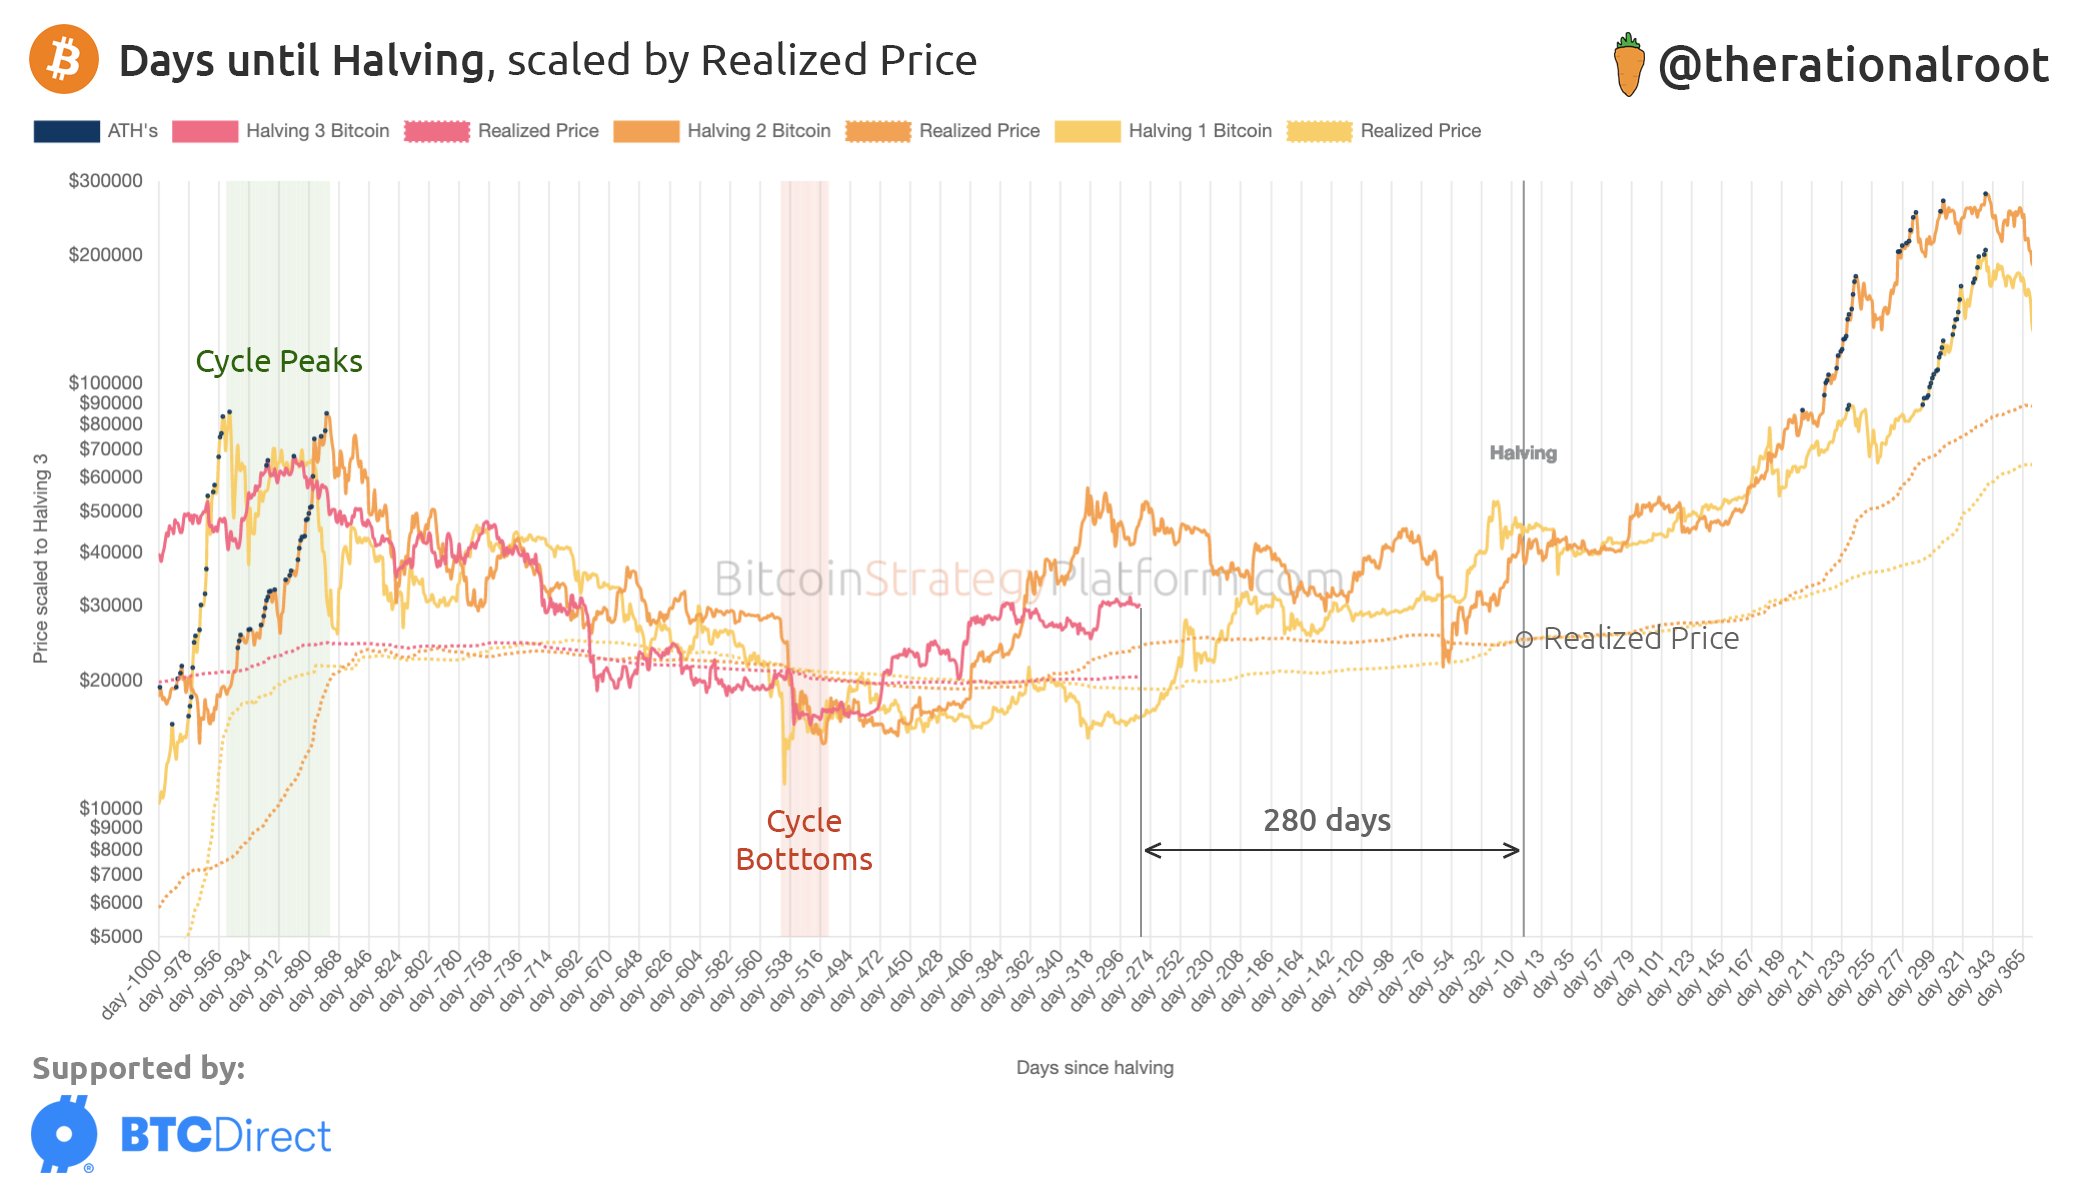
An analyst on Twitter has posted a chart that compares how the current BTC cycle looks like against the previous cycles when they were at similar points in their life as now:
Here, the Bitcoin cycles are scaled using the number of days since their respective halvings. In the graph, the analyst has highlighted something that’s immediately interesting; it’s the fact that the cyclical bottoms in the current and previous two cycles all took place at around the same number of days since the halving.
This is only assuming, of course, that the bottom observed after the FTX crash back in November 2022 was really the cyclical low for the ongoing cycle of the asset.
Likewise, the cycle peaks also appear to have occurred at similar points for the ongoing and the past couple of cycles (although the resemblance here isn’t as striking as for the bottoms).
In terms of where the last two cycles were at the stage of the ongoing cycle (that is, 280 days prior to the next halving): the previous epoch was at the height of the April 2019 rally, while two cycles ago BTC was in the early bull market buildup phase. It’s unclear currently which of these paths the current Bitcoin cycle might take.
In the chart, the data for the “realized price” for the asset during each cycle is also listed. In simple terms, what this price signifies is the cost basis (that is, the acquisition or buying price) of the average holder in the market.
It looks like this indicator has been remarkably close during the previous two cycles, and the current one hasn’t been different so far either. At the current stage of the cycles, the realized price had split a bit between the last two cycles as they took different paths toward the halving.
The Bitcoin realized price is currently right between these two curves, further showing the uncertainty of which of the two paths BTC might follow, if either of them at all.
BTC Price
At the time of writing, Bitcoin is trading around $29,800, down 4% in the last week.
