- November 16, 2023
- Posted by: admin
- Category: BitCoin, Blockchain, Cryptocurrency, Investments
Monitoring the movement of Bitcoin‘s supply, particularly when categorized by the time since last active, is pivotal for understanding investor behavior and forecasting market trends. This analysis sheds light on the current state of Bitcoin holdings and provides critical insights into its future movements.
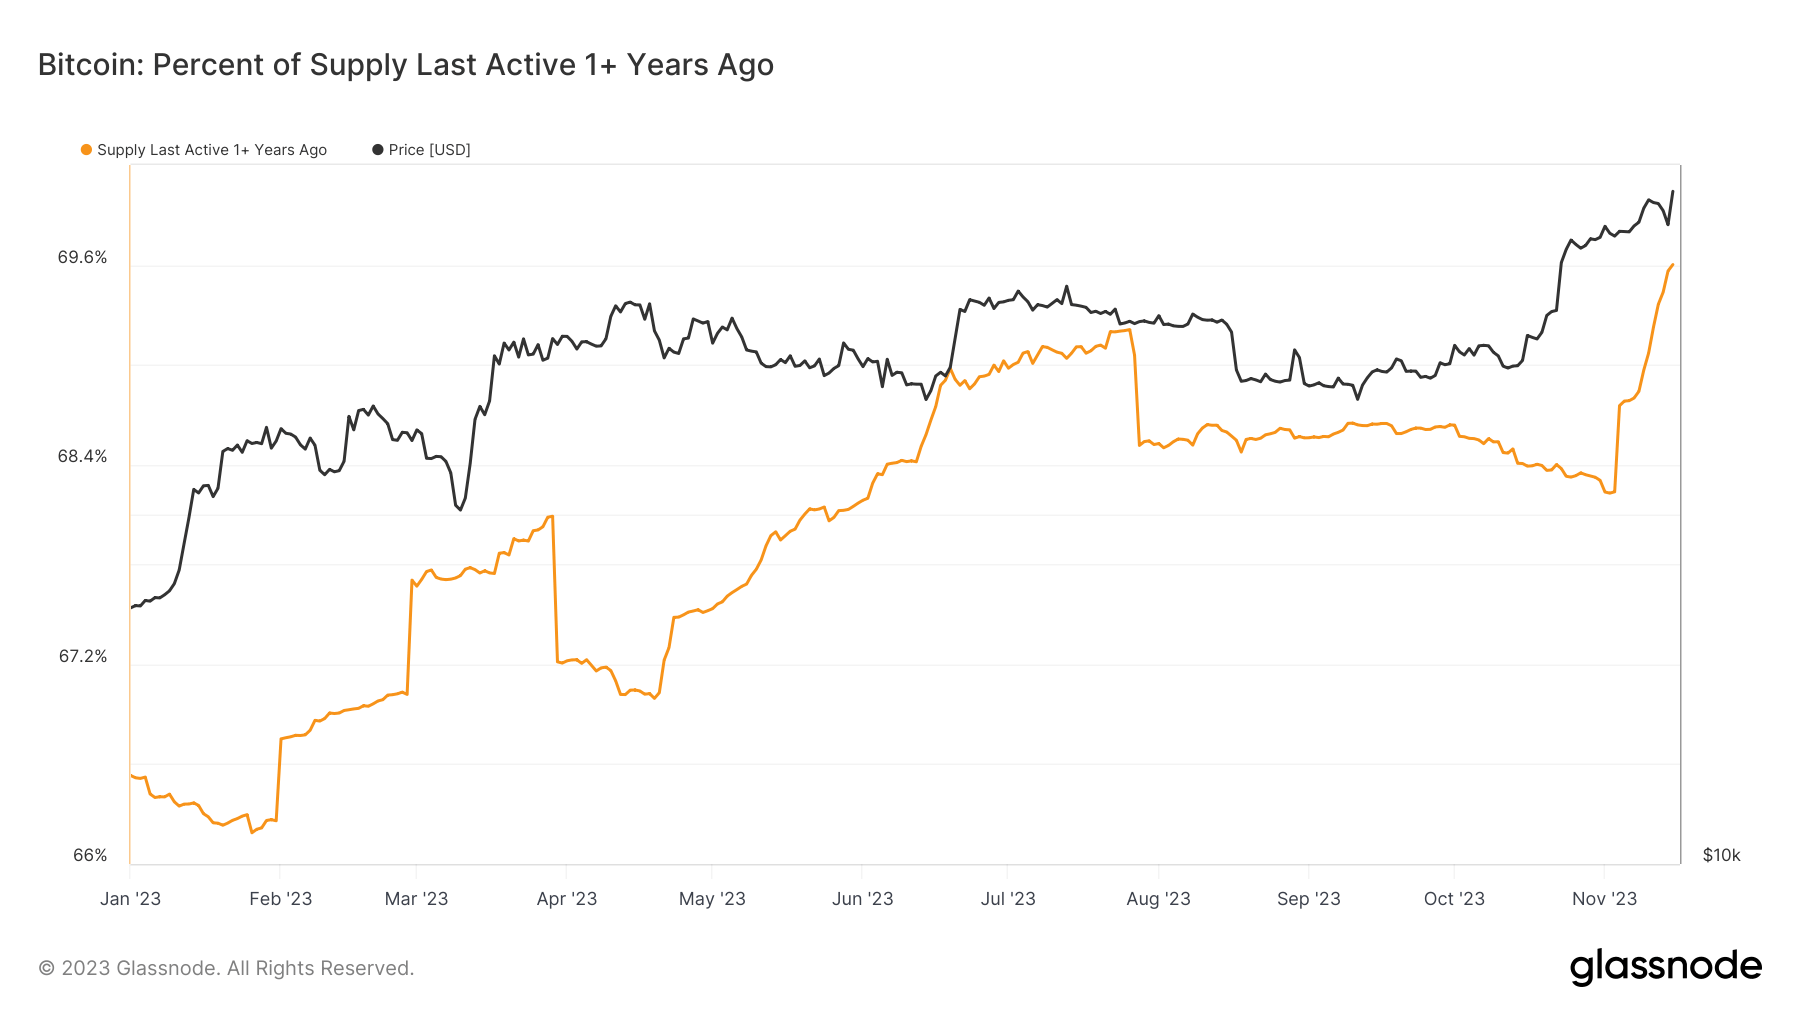
There has been a remarkable shift in Bitcoin’s supply dynamics that followed its recent price rally. In just over a month, Bitcoin’s price surged from $26,846 to $37,964. During the same period, the percentage of Bitcoin’s supply last moved over a year ago increased by around 4%, indicating a heightened tendency among investors to hold their assets for longer durations.
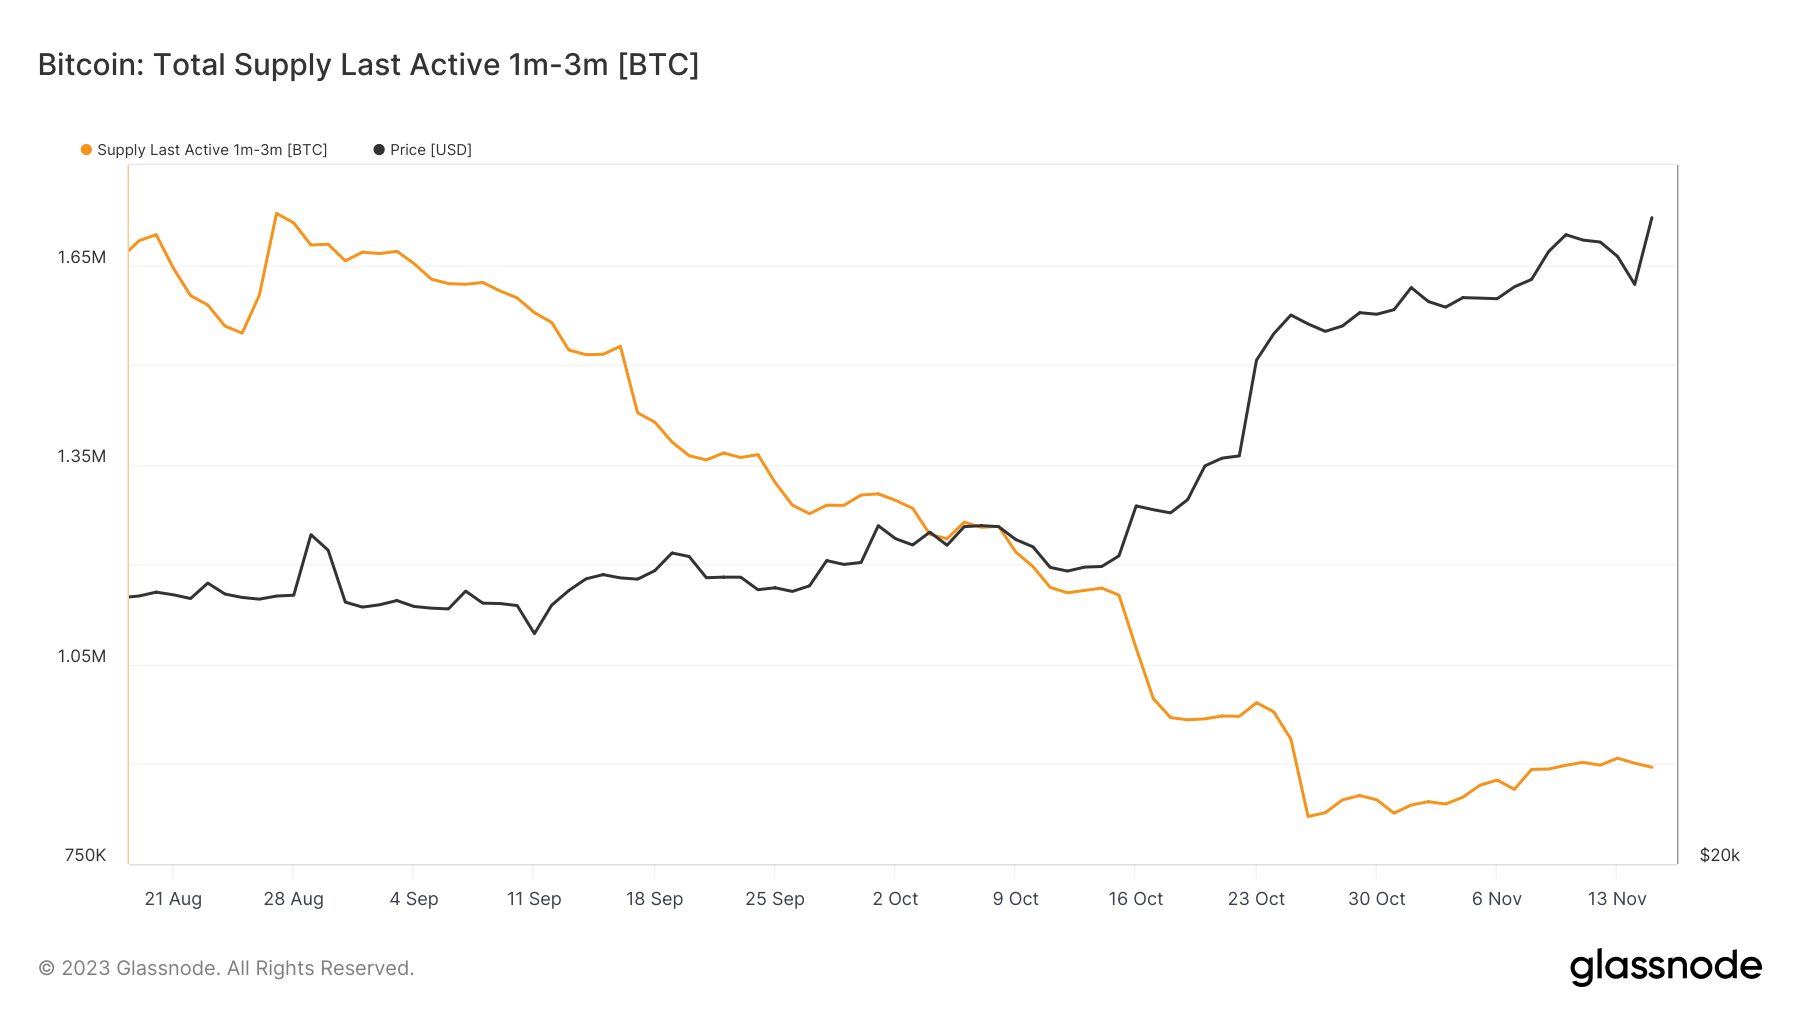
This period also saw changes in shorter-term supply movements: the supply last active for 1-3 months decreased from 1.16 million BTC to 895,347 BTC, a substantial drop of approximately 22.7%, reflecting a decline in short-term trading activities.
These trends are indicative of a broader sentiment among Bitcoin holders. The increasing percentages in the supply last moved categories, especially over a year, highlight a strong inclination towards holding Bitcoin as a long-term investment or a store of value. This behavior suggests a maturing market where investors are less reactive to short-term price fluctuations and more confident in the long-term prospects of Bitcoin.
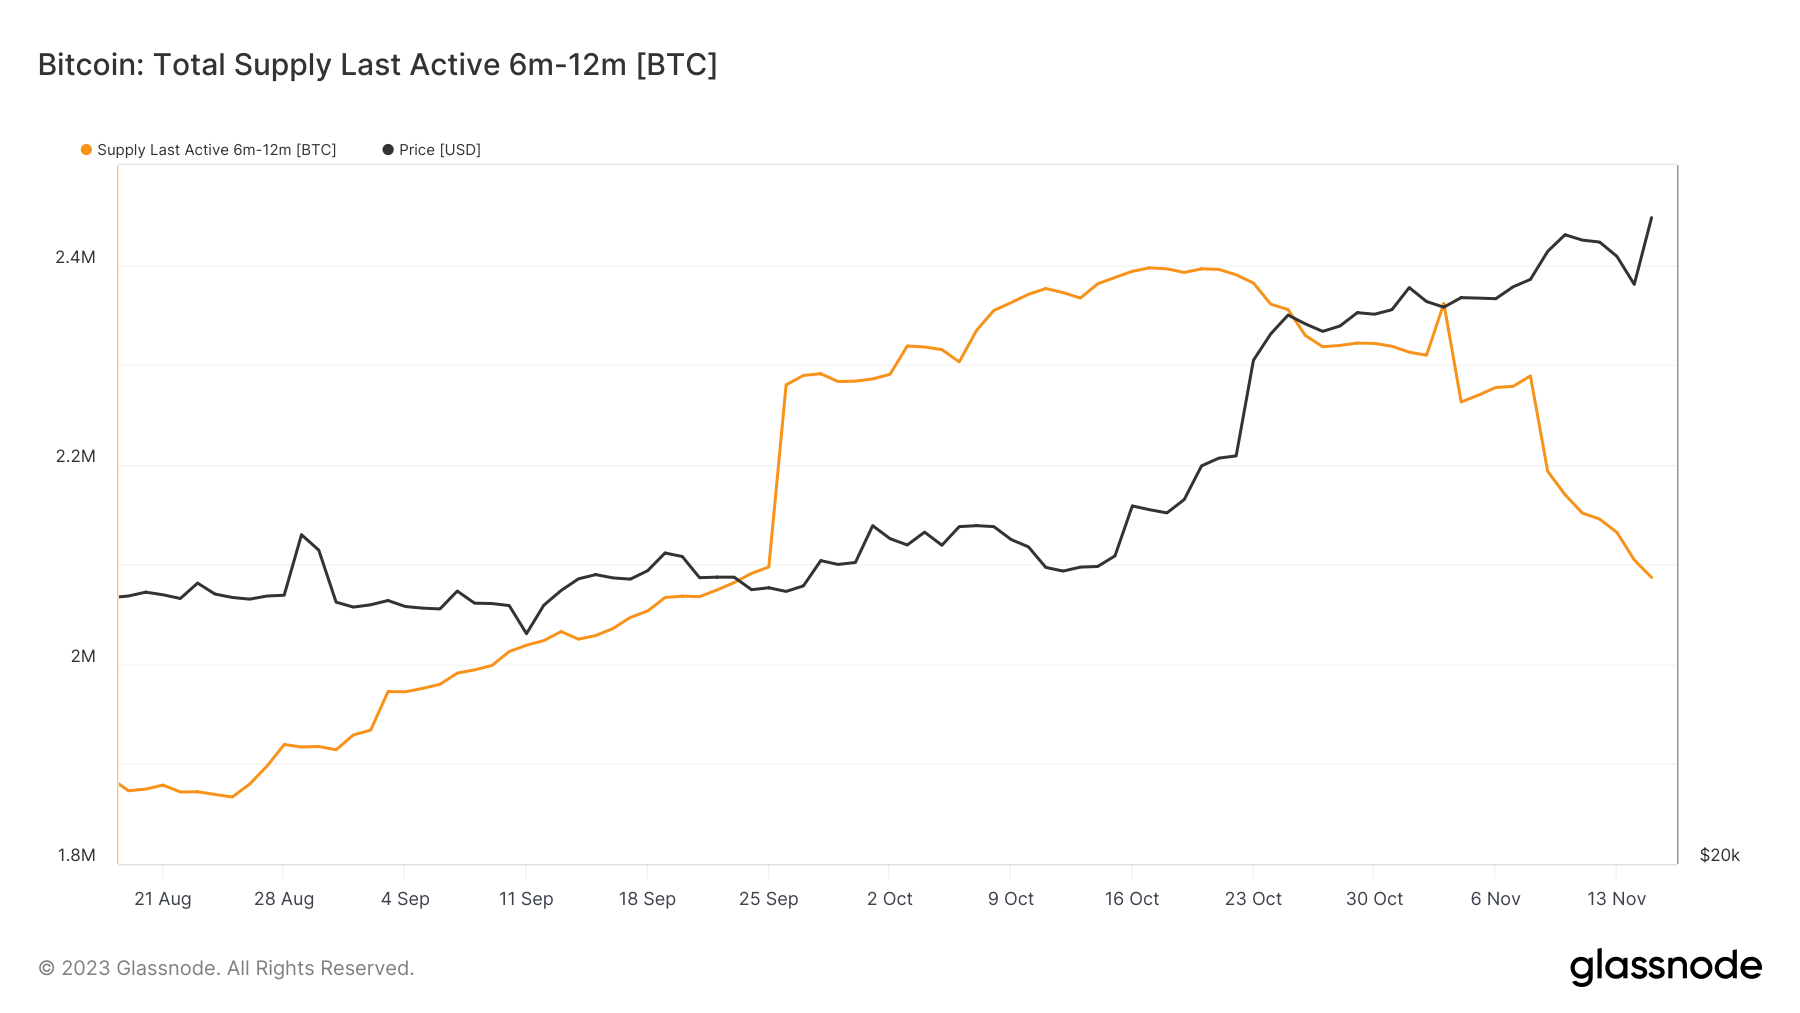
The supply last active in the 3-6 and 6-12 months categories also showed intriguing movements. The 3-6 months category saw an increase followed by a slight decrease, while the 6-12 months category consistently decreased.
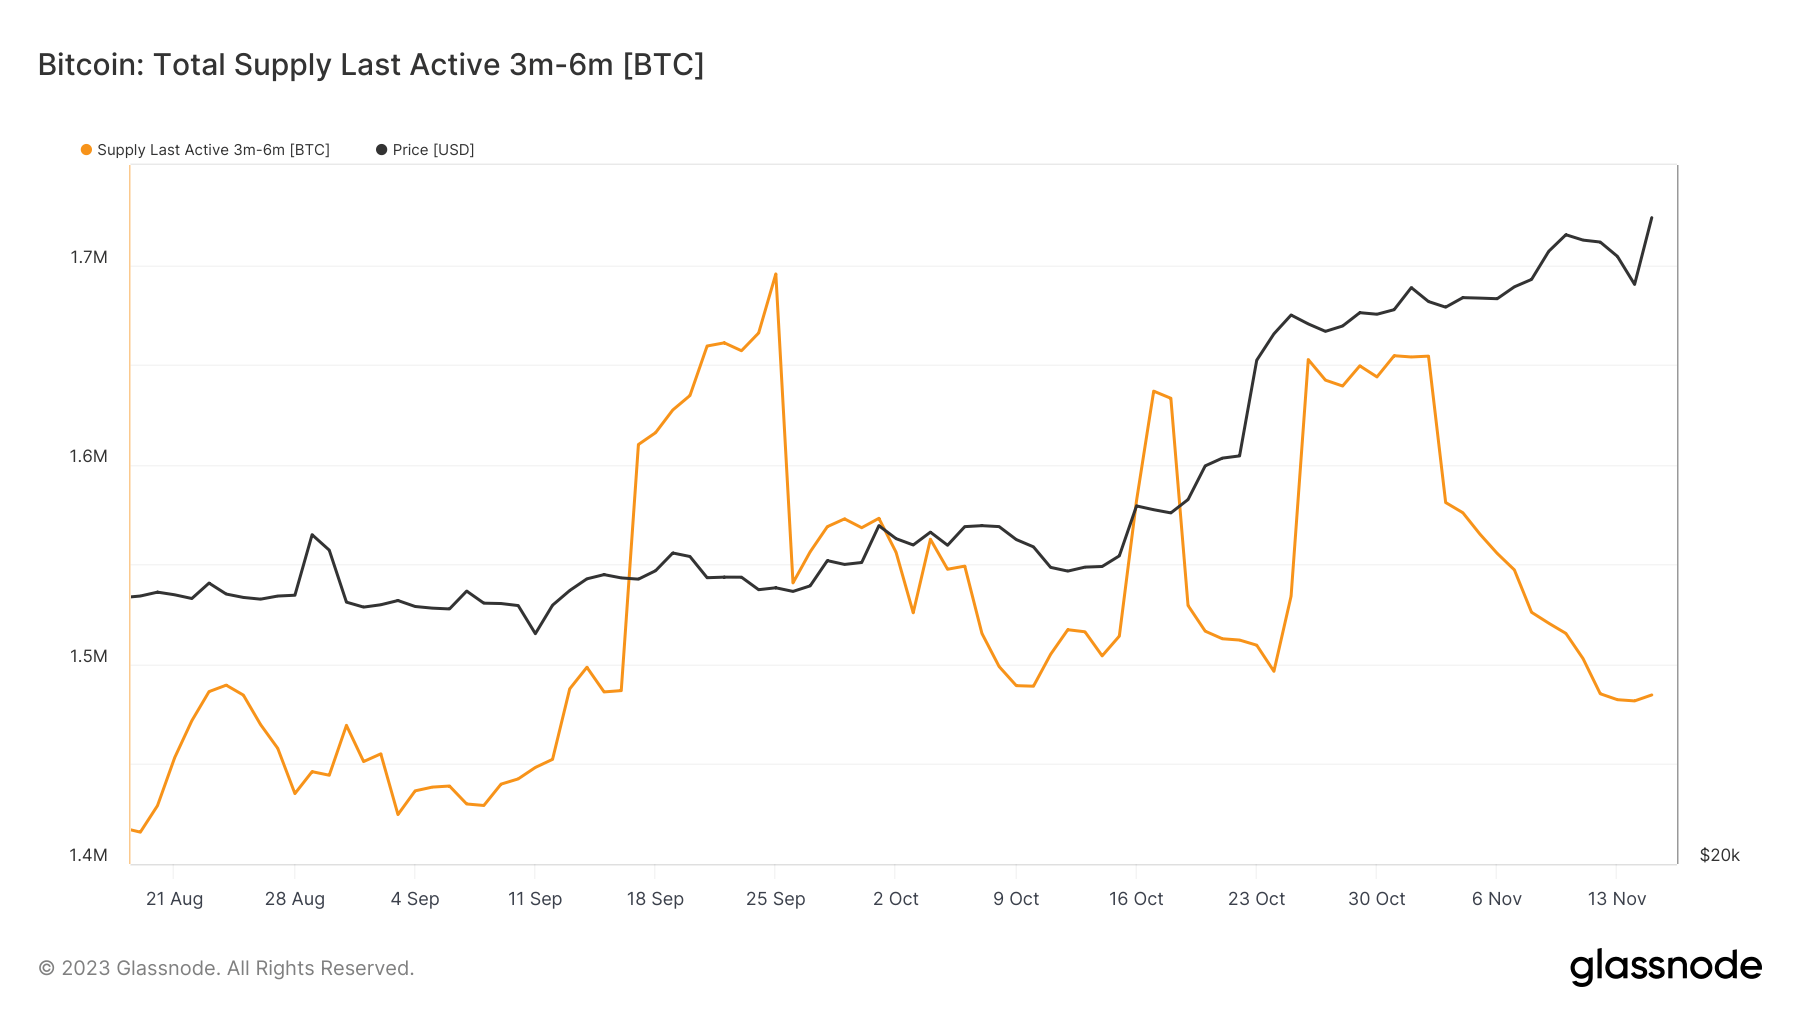
This fluctuation might indicate a movement of Bitcoin from a relatively dormant state (6-12 months) to a more active state (3-6 months), potentially in response to market developments or price movements.
These supply dynamics are crucial for understanding the liquidity and stability of the Bitcoin market. A significant portion of Bitcoin being held for extended periods leads to a decrease in the circulating supply, which can contribute to price increases, especially in the context of Bitcoin’s capped supply. On the other hand, low liquidity, marked by less supply available for trade, can lead to increased price volatility.
The insights drawn from this analysis are not just reflective of current market conditions but also predictive of potential future trends. For instance, if a considerable portion of Bitcoin that has been held for over three years starts becoming active, it might signal a potential selling pressure, possibly leading to a price decrease. Moreover, the reaction of these supply categories to external events can provide valuable insights into how different investor segments perceive and react to these developments.
The post Analyzing Bitcoin’s supply trends as surge in long-term Bitcoin holdings points to investor confidence appeared first on CryptoSlate.


