- December 1, 2023
- Posted by: admin
- Category: BitCoin, Blockchain, Cryptocurrency, Investments
Quick Take
Bitcoin’s price drawdown, which refers to the decline from its peak price of $69,010 in November 2021, has now reduced to under 45%. This development comes after a 750-day journey from its peak and a challenging bear market period in November 2022, when the digital asset experienced a 75% drawdown.

Interestingly, the current scenario mirrors a similar drawdown experienced in September 2020, potentially indicating a cyclical pattern that could forecast future market movements. This trend adds to Bitcoin’s narrative of recovery and resilience, showing how it navigates through market fluctuations.
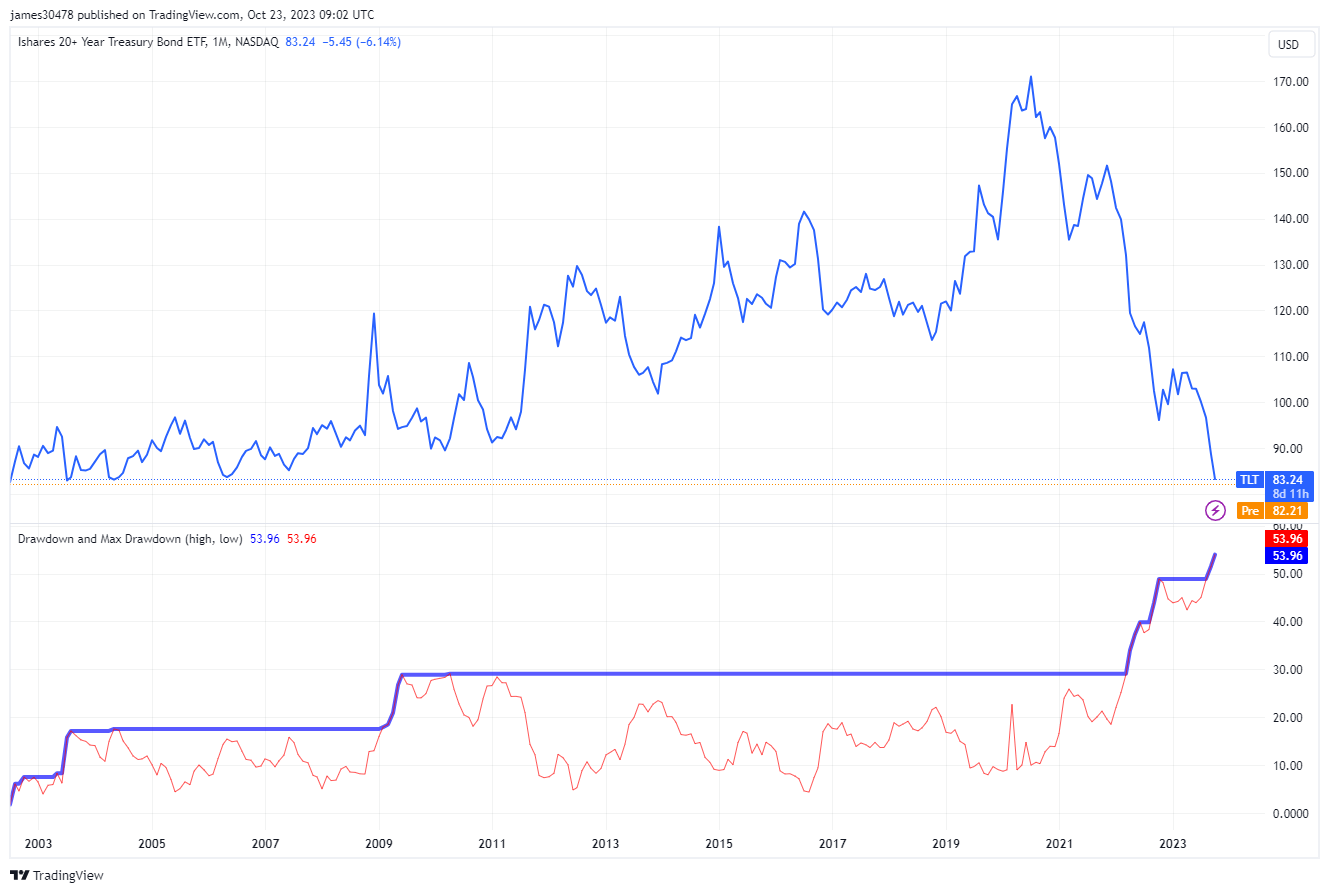
Nearly two months have passed since CryptoSlate first reported on the TLT drawdown. TLT, known as the iShares 20+ Year Treasury Bond ETF, is a financial instrument that tracks the performance of long-term U.S. Treasury bonds with maturities exceeding 20 years. It offers investors exposure to U.S. government bonds, a cornerstone of many investment portfolios. As of Dec. 1, TLT has experienced a decrease of 52% from its all-time high, which is substantially more than Bitcoin.

The post Bitcoin’s drawdown from ATH drops under 45% appeared first on CryptoSlate.
