- January 4, 2024
- Posted by: admin
- Category: BitCoin, Blockchain, Cryptocurrency, Investments
Bitcoin has seen a plummet of almost 7% today as on-chain data shows the miners have continued to apply their selling pressure.
Bitcoin Miner Reserve Has Continued To Head Down Recently
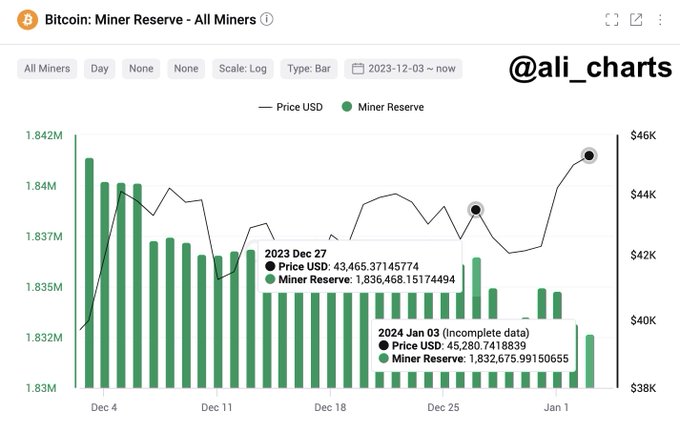
As pointed out by analyst Ali in a new post on X, the BTC miners have made some hefty selling moves during the last 10 days. The indicator of interest here is the “miner reserve,” which keeps track of the total amount of Bitcoin the miners are carrying in their wallets.
When the value of this metric goes down, it means that these chain validators are currently transferring their coins out of their addresses. Generally, one of the main reasons miners would decide to withdraw is for selling purposes, so this kind of trend can have a bearish impact on BTC.
On the other hand, the indicator increasing in value implies this cohort is currently receiving a net number of coins in its wallets. Such a trend may be a sign that the miners are accumulating, which can have bullish implications for the price in the long term.
Now, here is a chart that shows the trend in the Bitcoin miner reserve over the past month:
From the chart, it’s visible that the Bitcoin miner reserve has seen an overall downtrend during the past 10 days or so. This decrease in the metric could potentially be a sign that these chain validators have been applying selling pressure on the market.
At first, the miners were selling as BTC dropped from above the $43,000 level towards the lows seen before the recent rally. Once BTC hit the lows, though, some miners decided to use the opportunity to accumulate, as the reserve saw some rise.
After Bitcoin saw its sharp rally towards the $45,000 level, though, these chain validators once again made selling moves, as the indicator resumed its downwards trajectory. In total, miners have sold BTC worth $176 million in this period.
The analyst had shared the chart just before BTC’s crash today, in which the cryptocurrency has now declined into the $42,000 levels. Given the timing, it’s possible the latest profit-taking moves from the miners may have been a factor.
However, any contribution (if any at all) from these moves towards the plunge would only be slight, as the amount that miners have potentially sold isn’t too much in the grand scheme of things.
The on-chain analytics firm CryptoQuant might have pointed out a much more likely source of the selling pressure behind the crash in an X post.
As displayed in the chart, the mean amount of Bitcoin flowing into exchanges (more precisely, its 7-day simple moving average) has just risen to a 45-month high.
This would imply that most of the inflows going to exchanges are very large in value, a typical sign of whale activity. This selling pressure from the whales, which is of levels not witnessed since the COVID crash back in March 2020, could indeed explain the price plunge.
BTC Price
At the time of writing, Bitcoin is trading around $42,400, down 2% in the past week.

