- February 21, 2024
- Posted by: admin
- Category: BitCoin, Blockchain, Cryptocurrency, Investments

Quick Take
The recent surge in Bitcoin holdings among short-term holders (STHs), defined as investors who have held Bitcoin for less than 155 days, points to a noticeable increase. Since December, STHs have beefed up their Bitcoin portfolios by approximately 450,000 BTC. However, contrary to usual market behavior, soft indicators like Google trends suggest that we are not near market euphoria despite the aggressive accumulation from STHs.

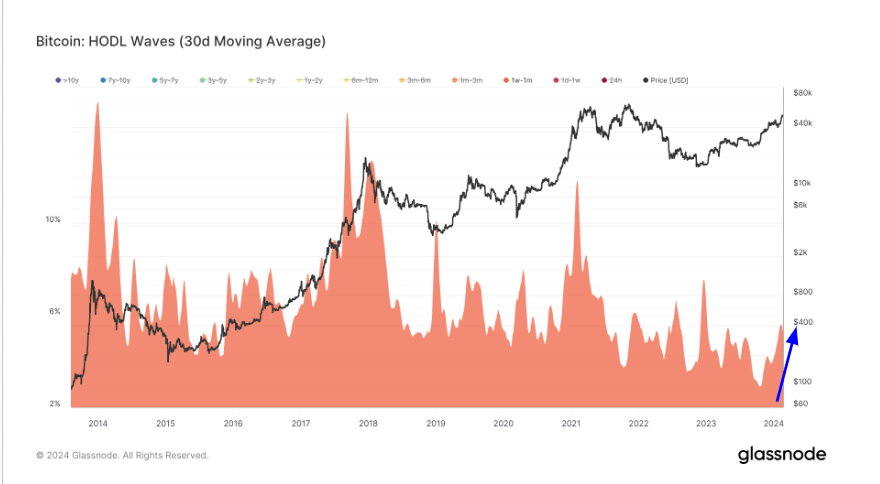
This intriguing pattern is further illuminated by examining HODL waves, a metric representing different age bands of active supply. HODL waves for the extremely short-term speculation bands – 24 hours, one day to 1 week, and one week to one month – were at an all-time low in October 2023, just as Bitcoin embarked on its journey from $25,000 to $53,000.

Even though these cohorts have grown significantly, they still represent extremely low percentages compared to historical data. This points to a distinct lack of extreme short-term speculation.
Furthermore, these cohorts typically wield a much larger percentage supply at the peak of bull markets when speculation is highest. This particular data suggests there is substantial room for growth in this cycle.

The post Analysis of HODL waves reveals a speculative market at play appeared first on CryptoSlate.
