- June 25, 2024
- Posted by: admin
- Category: BitCoin, Blockchain, Cryptocurrency, Investments
Onchain Highlights
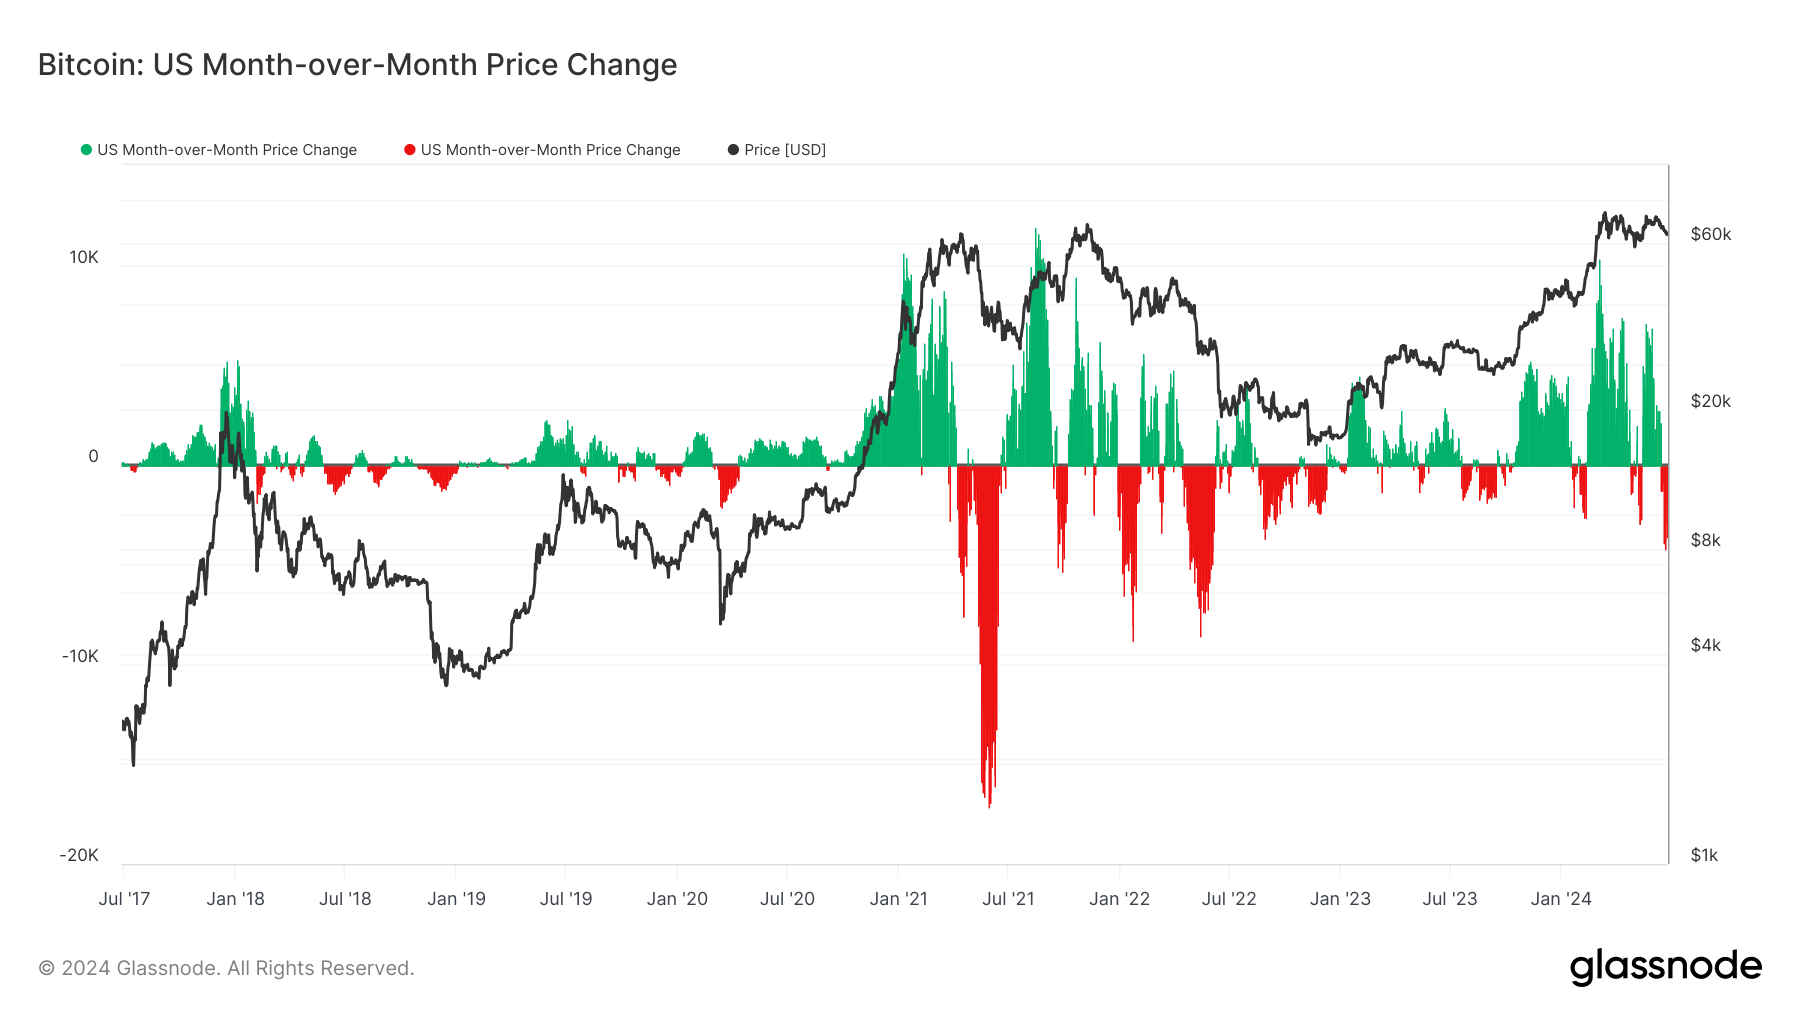
DEFINITION: This metric shows the 30-day change in the regional price set during US working hours, i.e., between 8 A.M. and 8 pm Eastern Time (13:00-01:00 UTC), respectively, and Eastern Daylight Time (12:00-0:00 UTC).
Regional prices are constructed in a two-step process: First, price movements are assigned to regions based on working hours in the US, Europe, and Asia. Then, regional prices are determined by calculating the cumulative sum of the price changes over time for each region.
Bitcoin’s month-over-month price change during US market hours demonstrates notable fluctuations over the past year. From July 2023 to June 2024, Bitcoin exhibited significant volatility, with marked increases and declines in price. The data reveals a trend of increased volatility starting in November 2023, dipping around the launch of the US ETFs and then peaking in March 2024, where the monthly price change during US hours approached a $10,000 increase. Following the April 2024 halving, Bitcoin has experienced notable downward movements after a brief rally in late May, with declines during US hours, reaching almost $5,000 from mid-June 2024.

Historical analysis shows that such volatility is not unprecedented. A longer timeframe, covering the years 2017 to 2024, indicates similar patterns of extreme price movements during US market hours, especially around significant events and major market shifts. For instance, the substantial price drops seen in mid-2021 and mid-2022 mirror the recent declines post-halving.

This cyclical pattern emphasizes the impact of Bitcoin’s halving events and broader market conditions on its price volatility during US trading hours. Analyzing these trends provides critical insights into potential future movements and investor sentiment within the digital assets market.
The post Bitcoin’s post-halving volatility during US hours reveals historical patterns appeared first on CryptoSlate.
