- March 12, 2026
- Posted by: admin
- Category: BitCoin, Blockchain, Cryptocurrency, Investments


The post Is a DOGE Price Breakout Loading? Here’s What Traders Should Watch Next appeared first on Coinpedia Fintech News
The Dogecoin price has entered a critical phase as the token continues to trade under sustained bearish pressure. Over the past several months, DOGE has been forming a series of lower highs, indicating weakening bullish momentum. The latest price action suggests that the meme coin may be approaching a decisive breakout or breakdown zone, which could determine its next major move.
While broader crypto market sentiment has shown signs of recovery, Dogecoin has struggled to maintain upward momentum, leaving traders closely watching key support levels.
DOGE Trades Within a Descending Triangle Structure
The weekly chart shows that Dogecoin price has been trading inside a descending triangle pattern, a formation that typically signals a continuation of the prevailing trend unless a strong breakout occurs. The pattern began to form after DOGE peaked near $0.45 in early 2025. Since then, the asset has consistently printed lower highs, creating a descending resistance trendline that continues to cap bullish attempts.
At the same time, price action has been gravitating toward the $0.09–$0.10 support zone, which has emerged as a critical level for buyers. As the triangle structure tightens, volatility has been gradually declining. Such compression phases often precede sharp directional moves, making the current price region particularly important for the market.
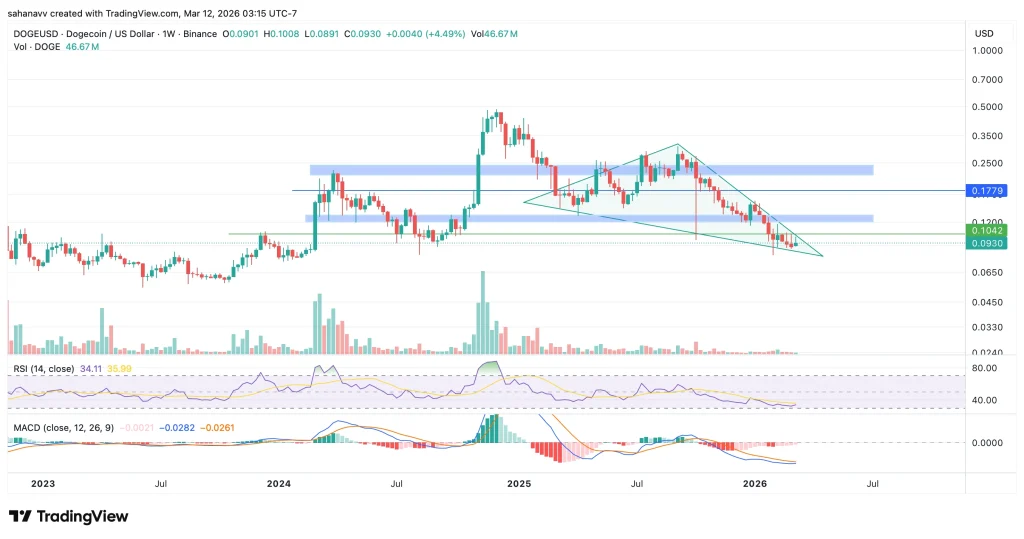
Technical indicators currently suggest that bearish momentum remains dominant. The Relative Strength Index (RSI) is hovering near the 34 level, indicating that selling pressure is still present. While the indicator is approaching oversold territory, it has yet to show a clear reversal signal.
Meanwhile, the MACD indicator remains in bearish territory. The MACD line continues to trade below the signal line, with the histogram showing persistent negative momentum. This setup reinforces the current downward trend visible on the chart.
Volume activity has also been declining over recent weeks, suggesting that traders are waiting for a clearer breakout signal before committing to large positions.
Key Levels to Watch in the Coming Weeks
From a technical perspective, the $0.09 support zone is currently the most important level for Dogecoin.If buyers manage to defend this level and trigger a rebound, DOGE could attempt to move toward the next resistance levels near $0.17 and $0.18, which previously acted as support before turning into resistance.
A successful breakout above this range could open the door for a stronger rally toward the $0.20–$0.25 supply zone, where heavy selling pressure previously emerged. However, if DOGE fails to hold the $0.09 support, the descending triangle pattern could trigger a breakdown scenario. In that case, the next potential downside targets may emerge near $0.075 and $0.065.
DOGE Price Outlook
At the current stage, Dogecoin appears to be trading within a decision zone where both bullish and bearish scenarios remain possible. The tightening triangle pattern indicates that volatility may expand soon, potentially leading to a significant price move.
Until DOGE either breaks above the descending resistance trendline or loses the key $0.09 support, the asset is likely to remain in consolidation. For traders and investors, the coming weeks could prove critical as the market awaits confirmation of the next major trend for Dogecoin.


