- February 22, 2024
- Posted by: admin
- Category: BitCoin, Blockchain, Cryptocurrency, Investments

Quick Take
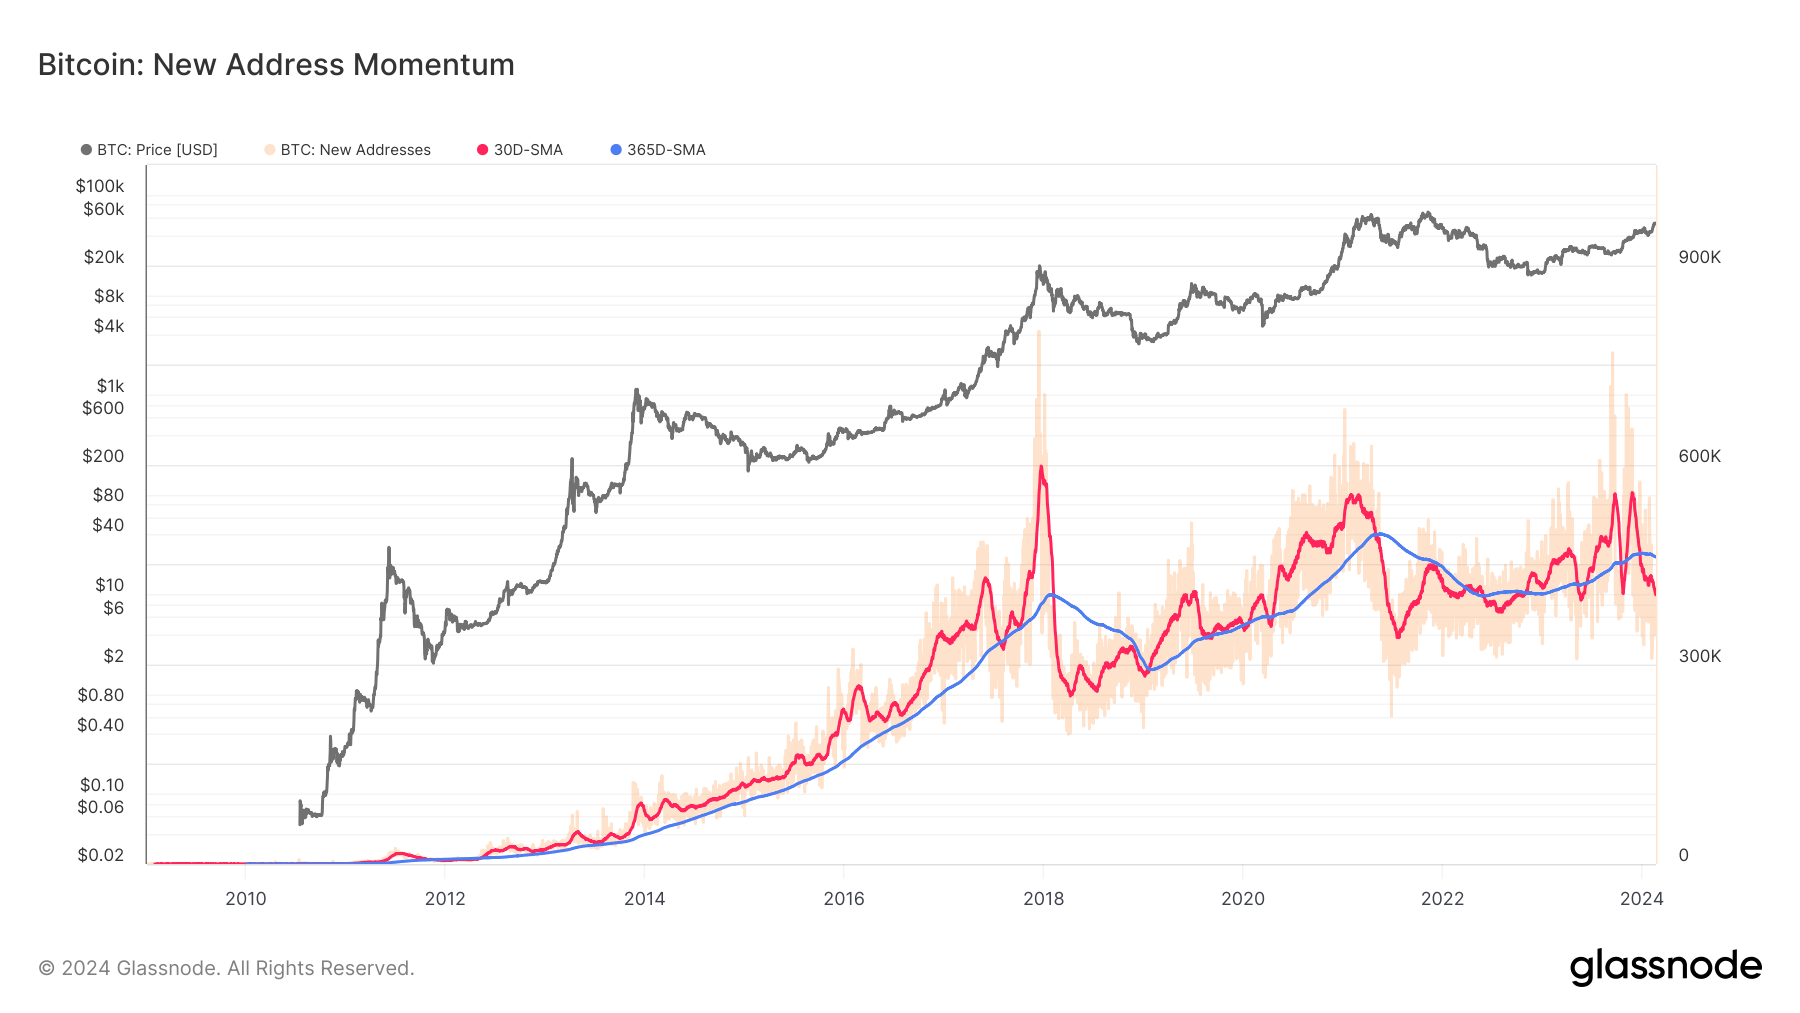
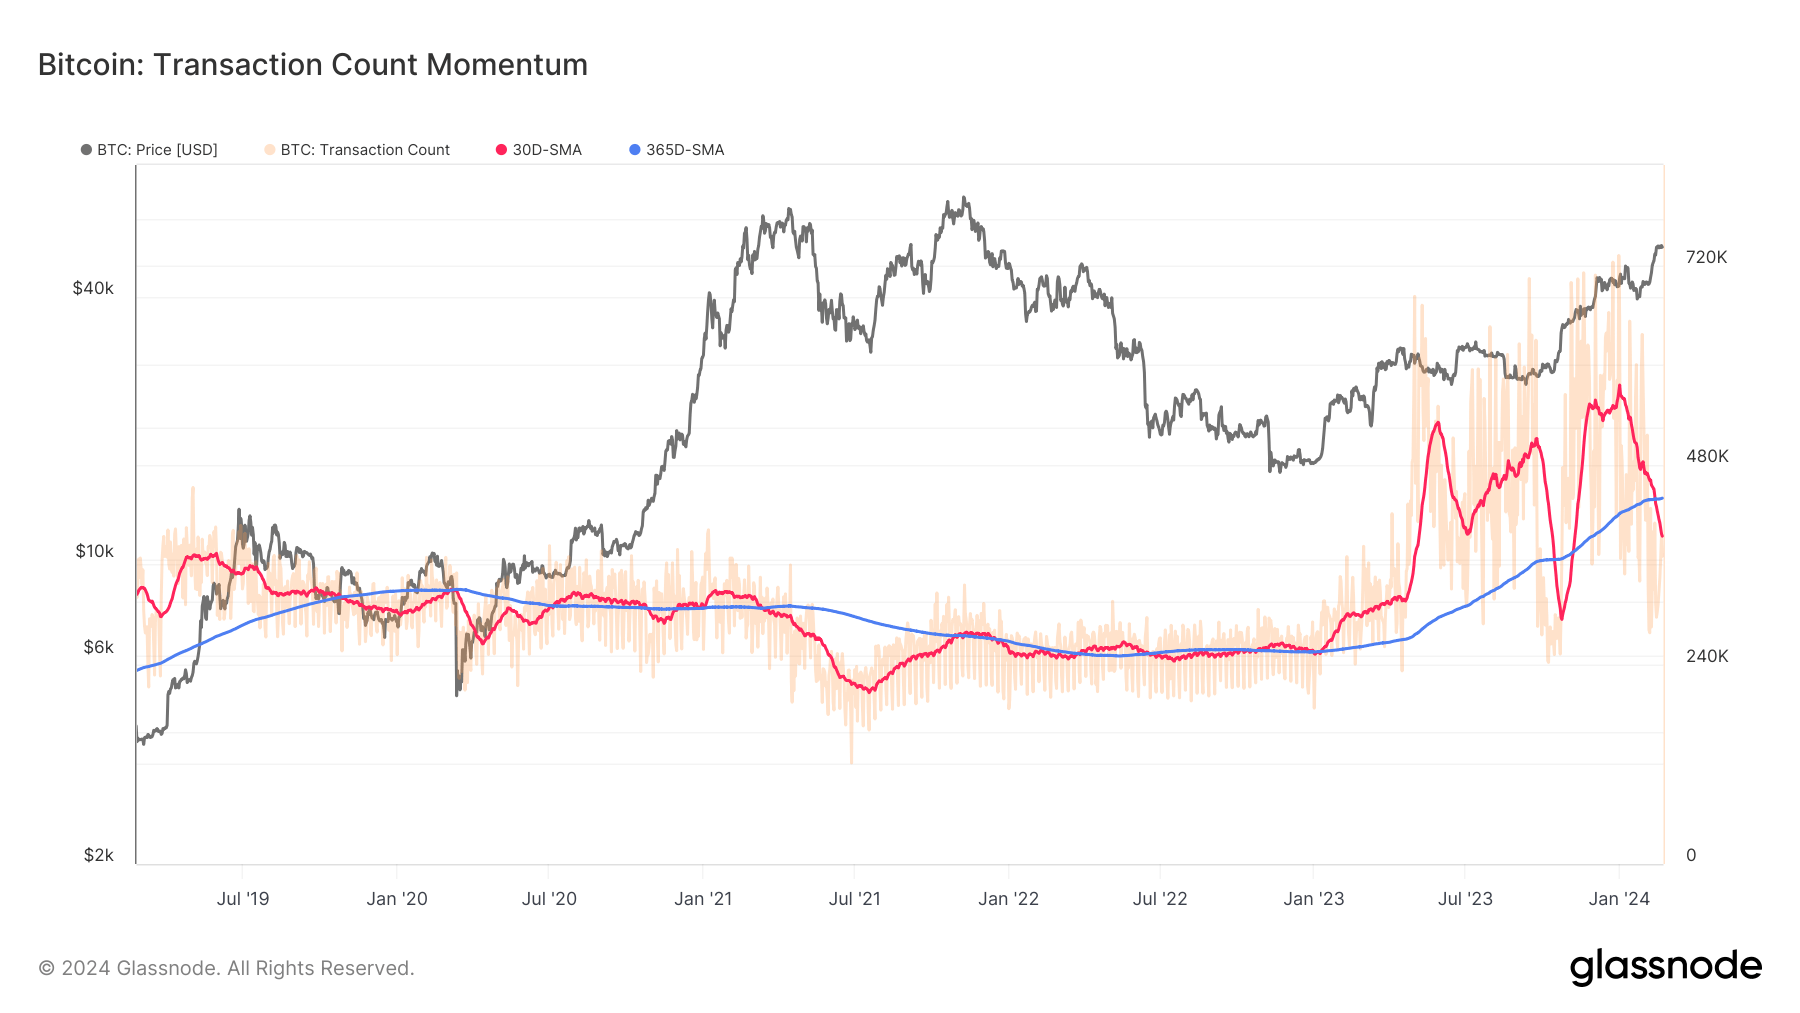
On-chain metrics grant an insightful glimpse into the health of the Bitcoin network. These indicators, namely new and active addresses and transaction counts, are barometers of the demand for Bitcoin’s blockspace. However, their daily fluctuations present an analytical challenge. A more efficient approach is to compare monthly averages against yearly benchmarks.
When juxtaposed with the yearly figure, an increase in the monthly average reveals an expansion in on-chain activity. This suggests strengthening network fundamentals and escalating network utilization. Conversely, a declining monthly average compared to the yearly metric hints at a contraction in on-chain activity, indicating weakening network fundamentals and decreased network utilization, according to Glassnode.

An example of this dynamic is the 2021 bear market, which, according to CryptoSlate observations, initiated in May, not November, after the all-time high. A noticeable dip in both transaction count and new address creation evidenced this.
Recently, however, despite a brief doubling of Bitcoin’s price since October 2023, the number of new addresses consistently fell short of the yearly average and continues on a downward trajectory, just as the transaction count’s momentum has also slipped below the annual average. These findings spell a potential decline in Bitcoin’s network health, a trend that warrants close monitoring.

The post On-chain metrics reveal Bitcoin network’s health hinting at potential decline appeared first on CryptoSlate.
