- September 20, 2023
- Posted by: admin
- Category: BitCoin, Blockchain, Cryptocurrency, Investments
Bitcoin futures have become an integral part of the cryptocurrency market. Futures are a financial instrument that allows investors to buy or sell Bitcoin at a predetermined price at a specified future date. These contracts allow traders to hedge against price volatility, making them a vital tool for risk management.
Perpetual futures stand out as a unique and valuable instrument within the futures market. Unlike traditional futures that have a set expiration date, perpetual futures don’t expire. This distinction allows traders to hold positions indefinitely, provided they pay periodic funding rates.
Monitoring the state of Bitcoin futures, especially perpetual futures, offers a lens into the broader health and sentiment of the crypto market.
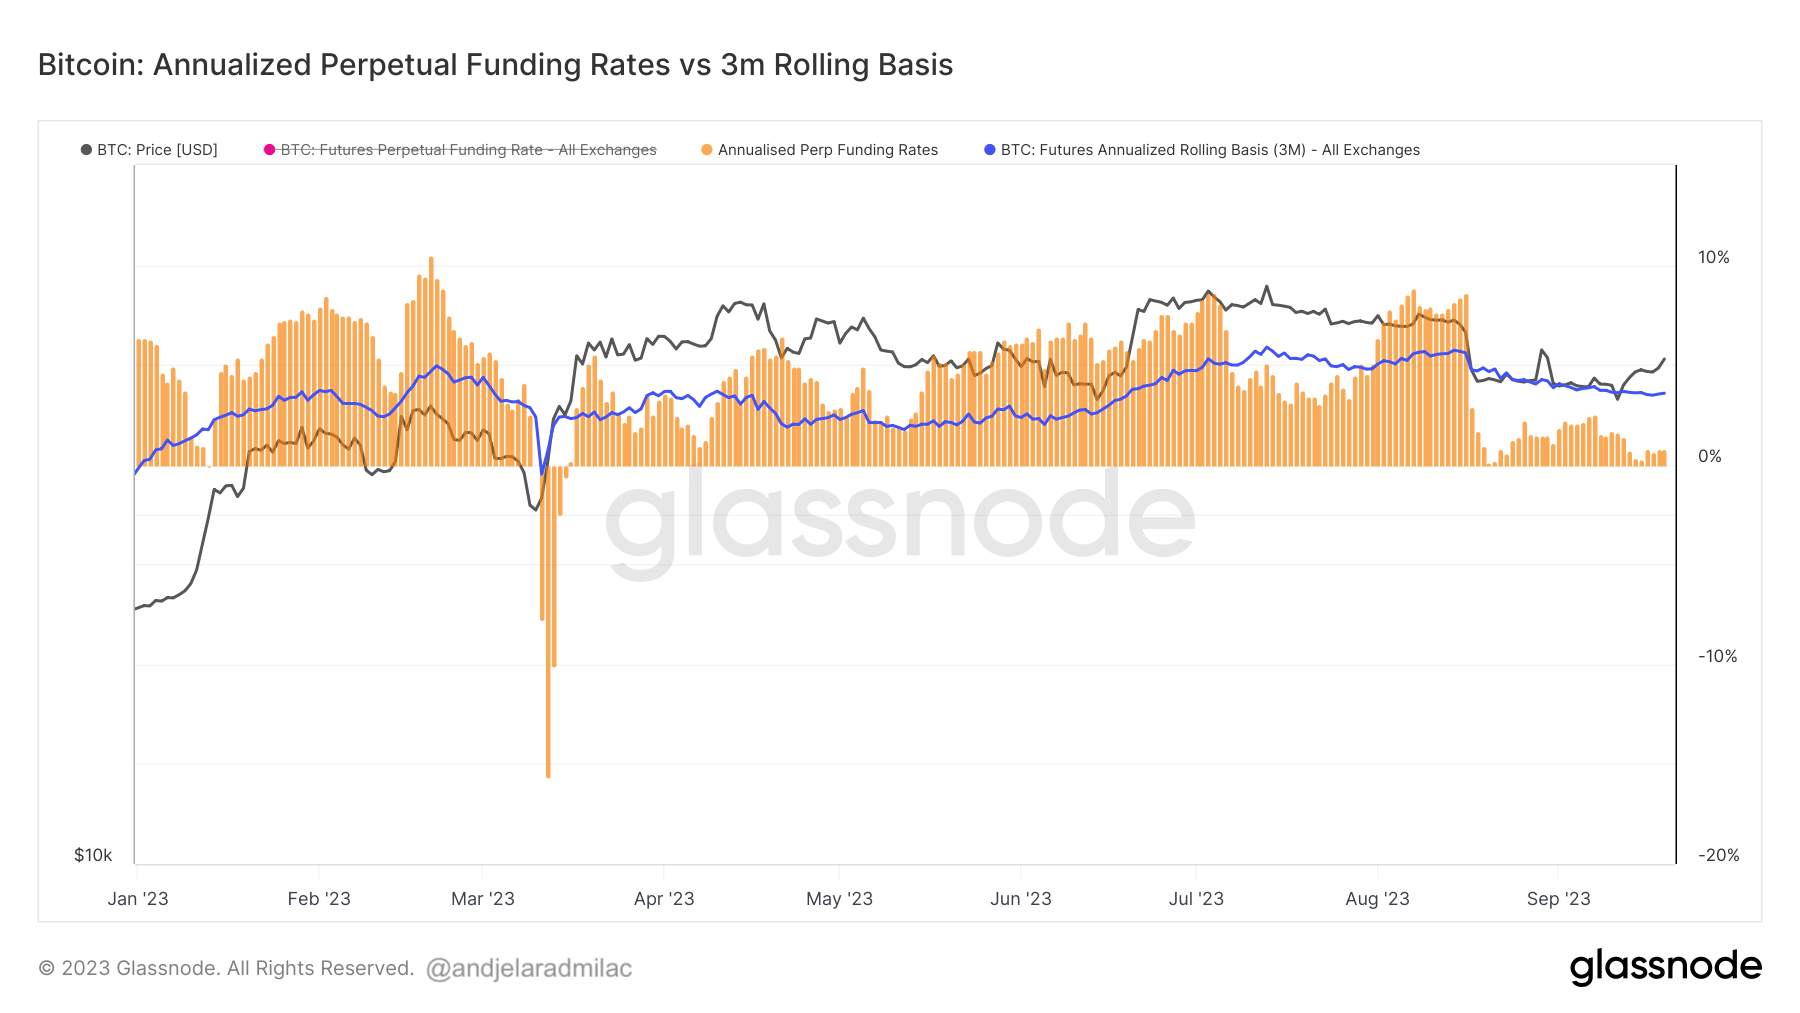
One metric that has proven particularly insightful is the comparison between the annualized perpetual funding rates and their 3-month rolling basis. Historically, when the annualized funding rate surged above the 3-month rolling basis, it almost always signaled an impending price downturn. Conversely, a price uptrend typically followed when the annualized funding rate dipped below the 3-month rolling basis or turned negative.
This phenomenon can be attributed to the demand for leverage in perpetual futures, which closely mirrors spot market price indexes. High demand for leverage can lead to an oversupply of sell-side contracts, prompting traders to arbitrage down the high funding rates.

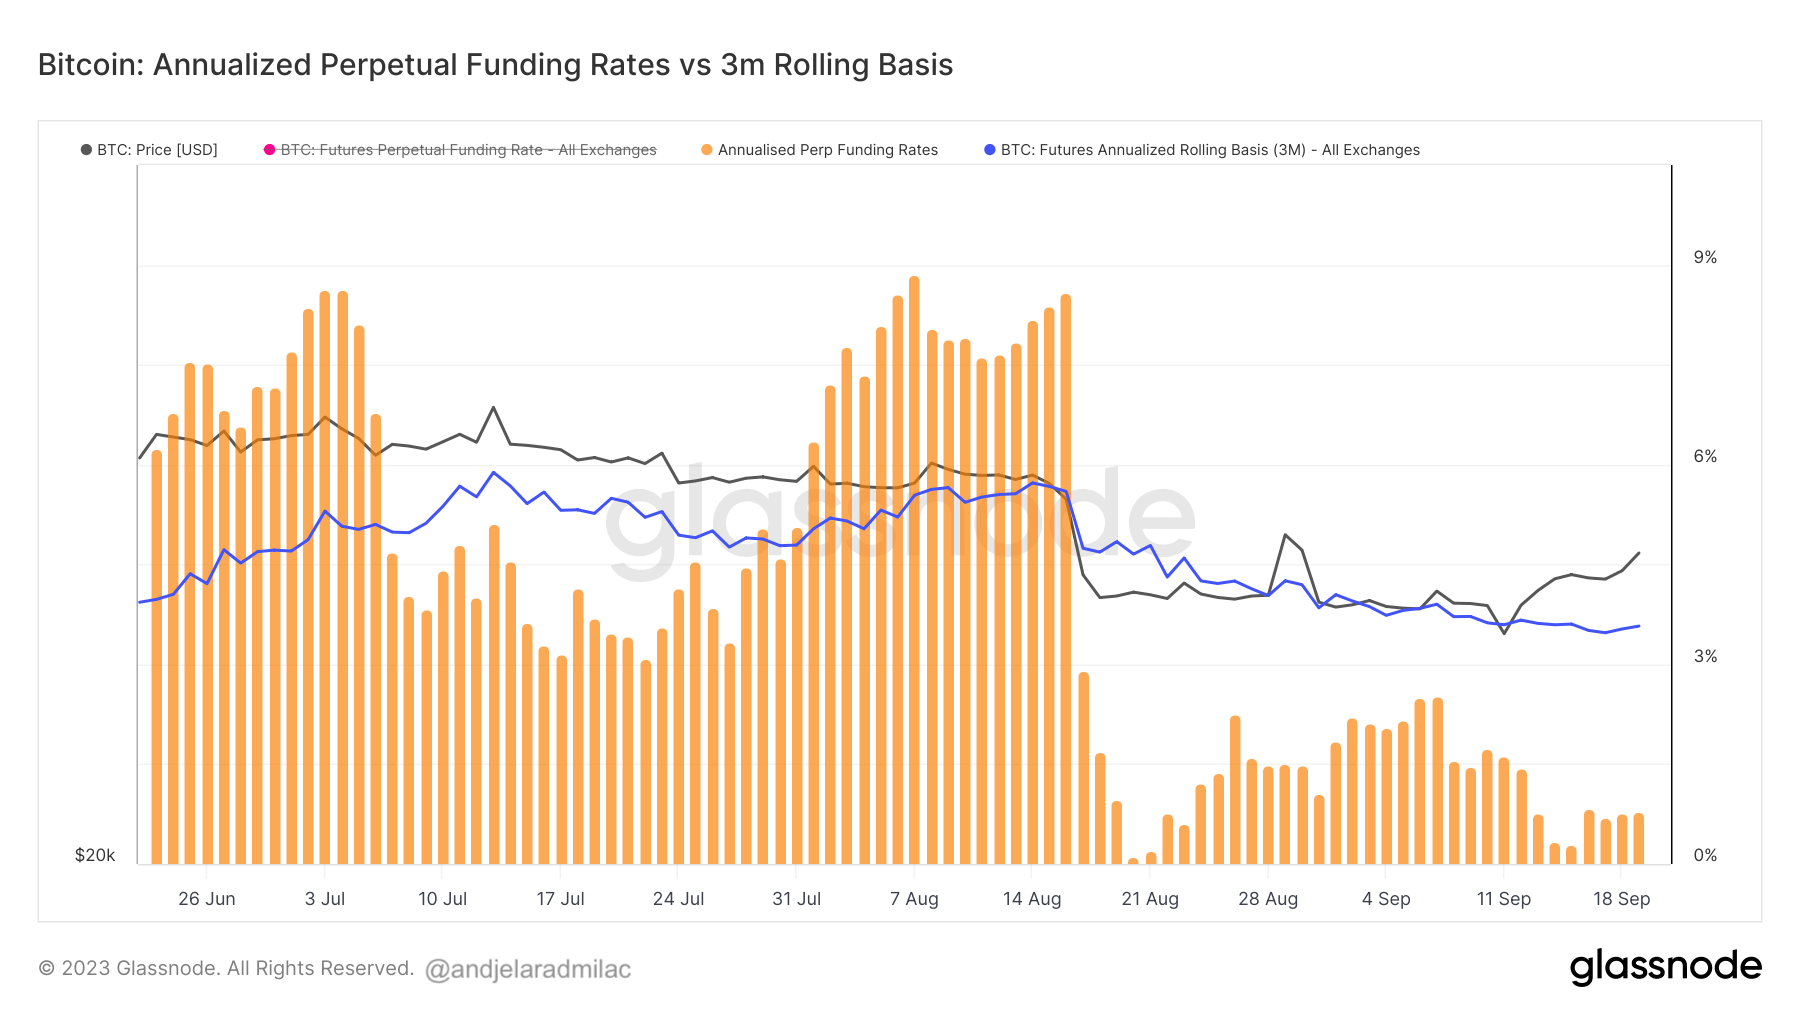
A recent case in point: on Aug. 17, the annualized perpetual funding rate plummeted below the 3-month rolling basis. This shift correlated with a significant drop in Bitcoin’s price, which dropped from $29,200 on Aug. 15 to $26,000 on Aug. 18.
As of Sep. 19, the annualized perpetual funding remains below the 3-month rolling basis, registering at 0.782%, while the 3-month rolling basis stands at 3.574%. This suggests that the market is currently de-risking, often observed after a downside price action or during bearish trends.

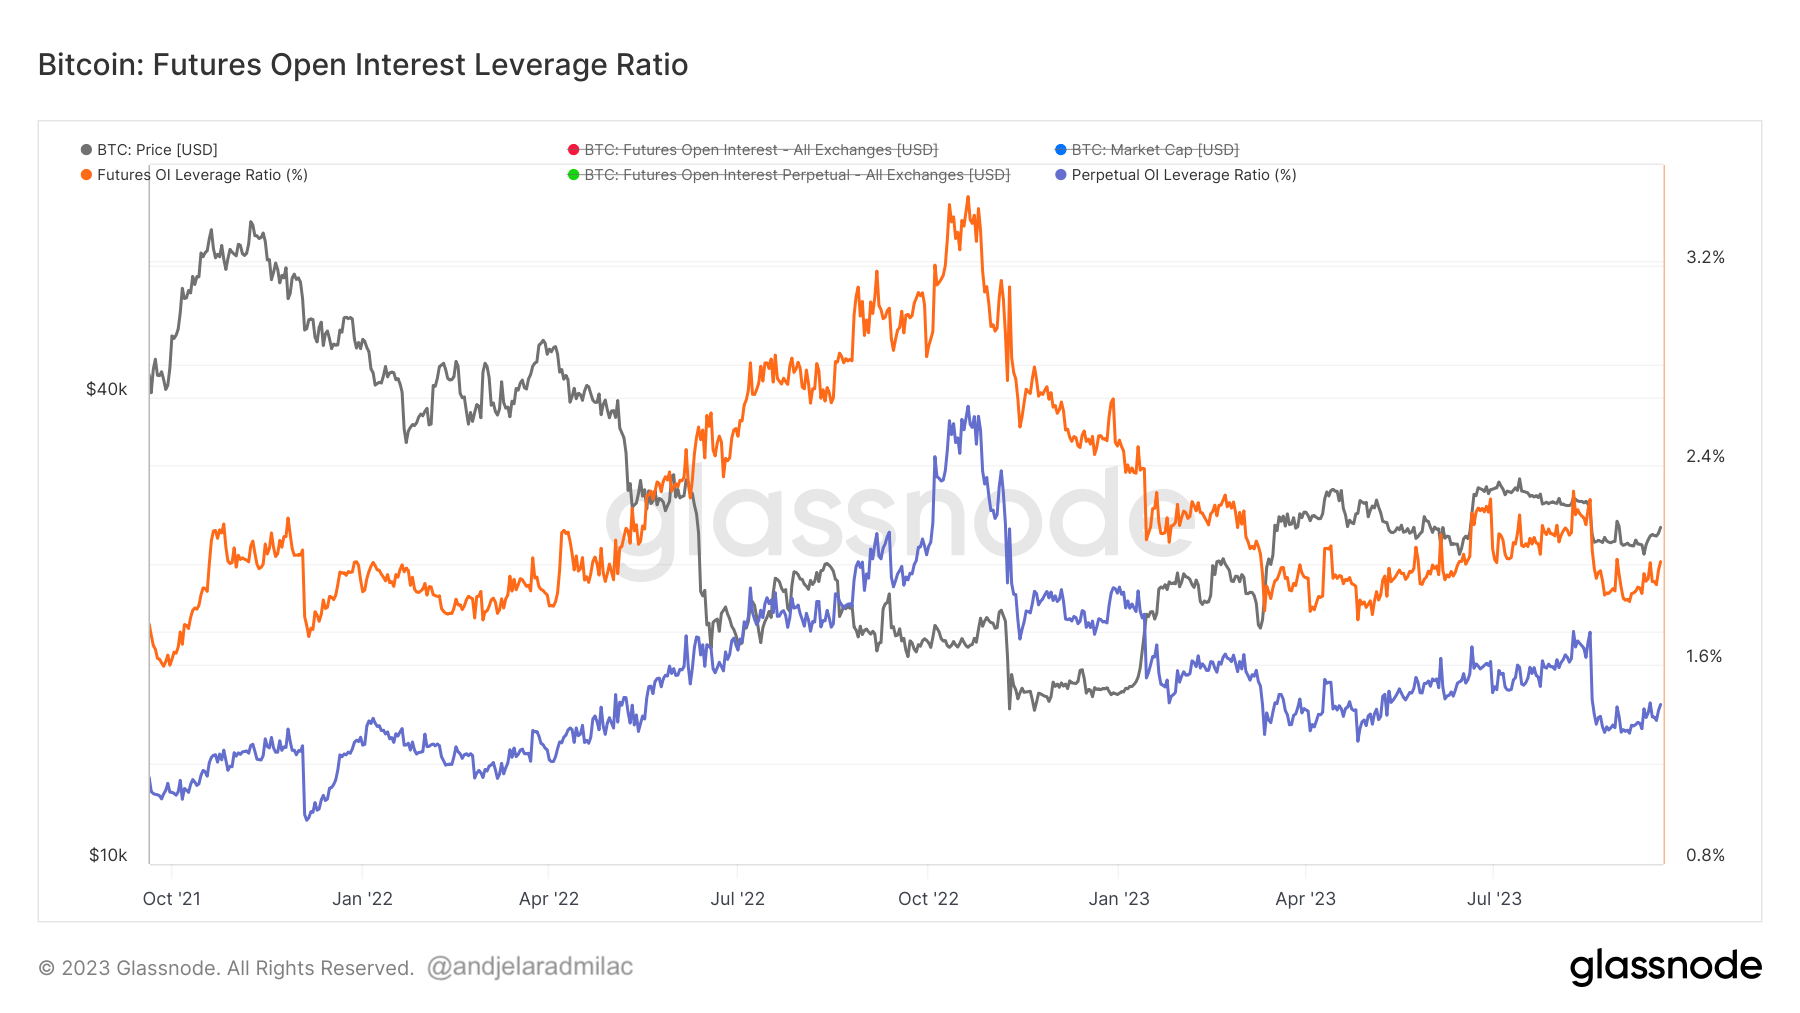
Another metric worth noting is the futures open interest leverage ratio. This ratio, calculated by dividing the market open contract value by the asset’s market cap, shows the degree of leverage in the market relative to its size.
High values indicate a considerable open interest compared to the market size, raising the risk of short/long squeezes or liquidation events. Conversely, low values suggest a more stable market environment with reduced risk of forced buying or selling.

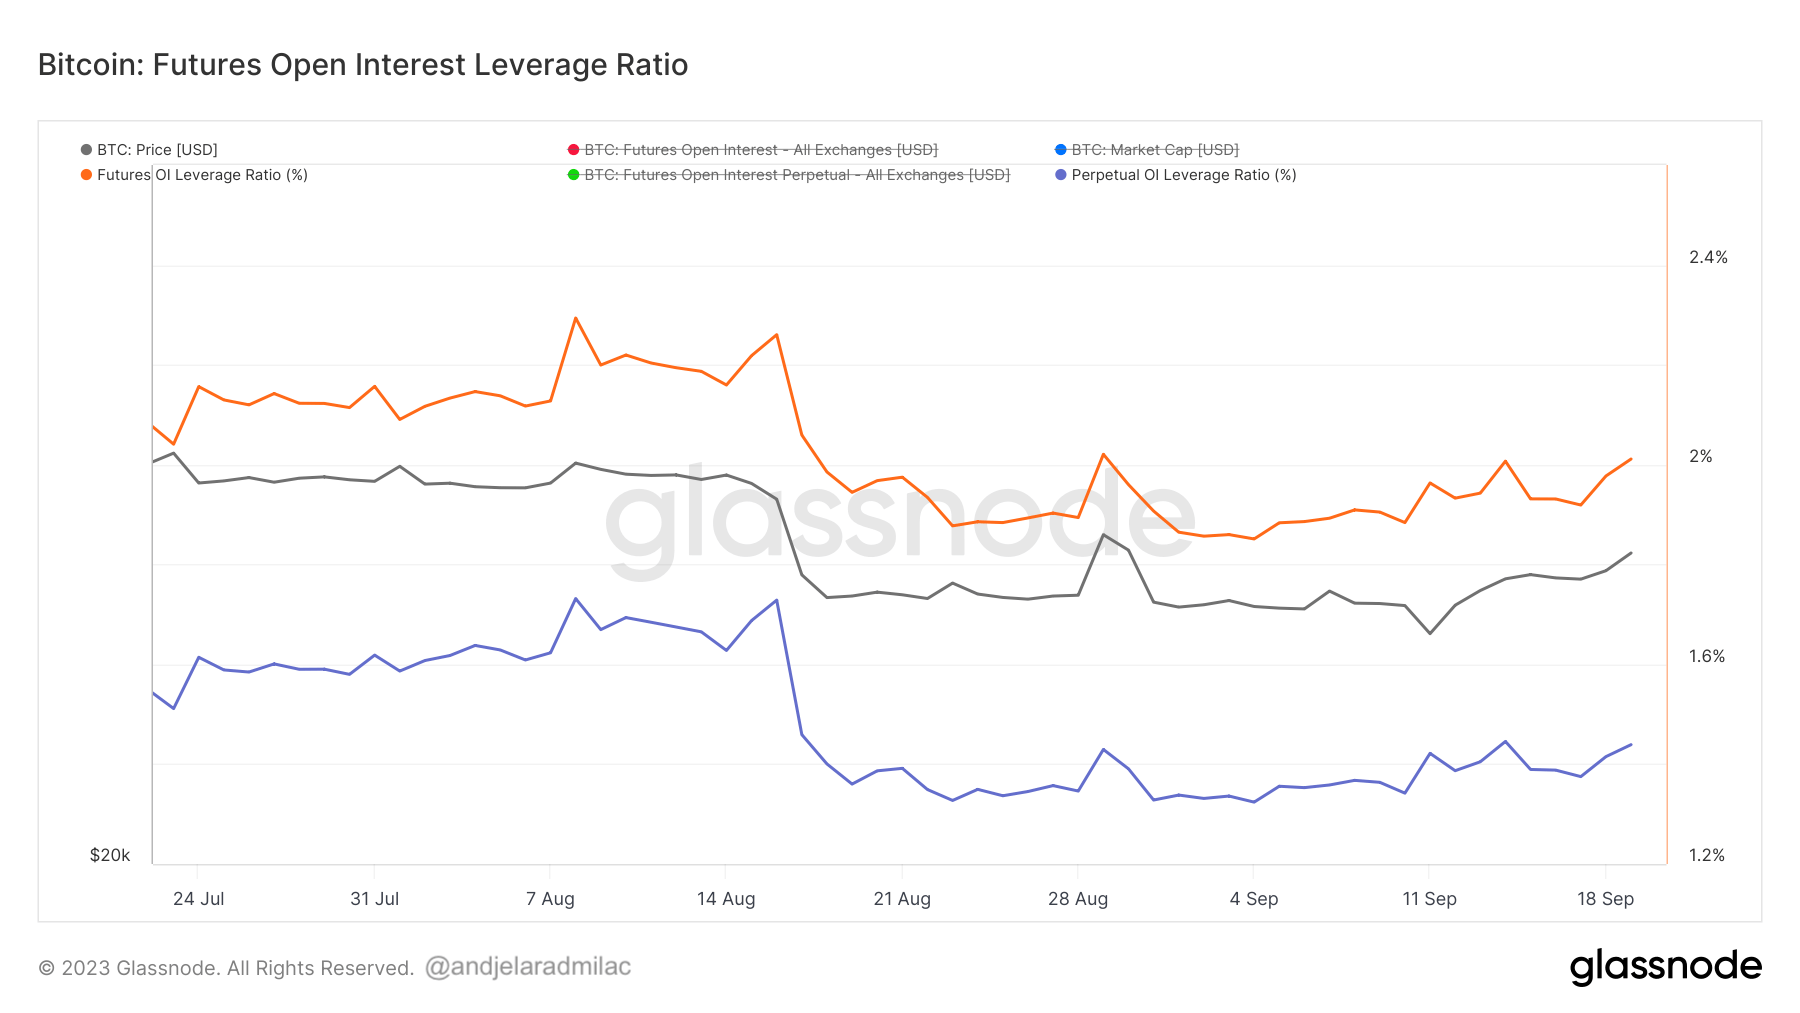
On Aug. 17, a sharp decline in this ratio was observed, showing a sizeable deleveraging event in the market. By Sep. 19, the futures open interest leverage ratio was 2%, with the perpetual open interest leverage ratio at 1.439%. These figures marked an increase from 1.9% and 1.3% since Sep.18, correlating with Bitcoin’s price surge past $27,000.

As indicated by the annualized funding rate and its 3-month rolling basis, the current de-risking environment can show caution among traders, possibly in anticipation of further price fluctuations or external market events. The recent increase in the futures open interest leverage ratio hints at renewed confidence among traders, especially after a sharp decline in the ratio as observed on Aug. 17.
However, a rising leverage ratio can be a double-edged sword. While it might indicate strong market participation, it can also raise the volume of potential short/long squeezes and increase the likelihood of liquidation cascades.
These metrics paint a picture of a market that is treading carefully. Traders balance their optimism with precaution, bracing for the volatility they expect to hit the market.
The post What perpetual futures tell us about the current Bitcoin market appeared first on CryptoSlate.
