- January 23, 2024
- Posted by: admin
- Category: BitCoin, Blockchain, Cryptocurrency, Investments
On-chain data lets us see the extent and scope of the activity surrounding spot Bitcoin ETFs beyond its impact on BTC price.
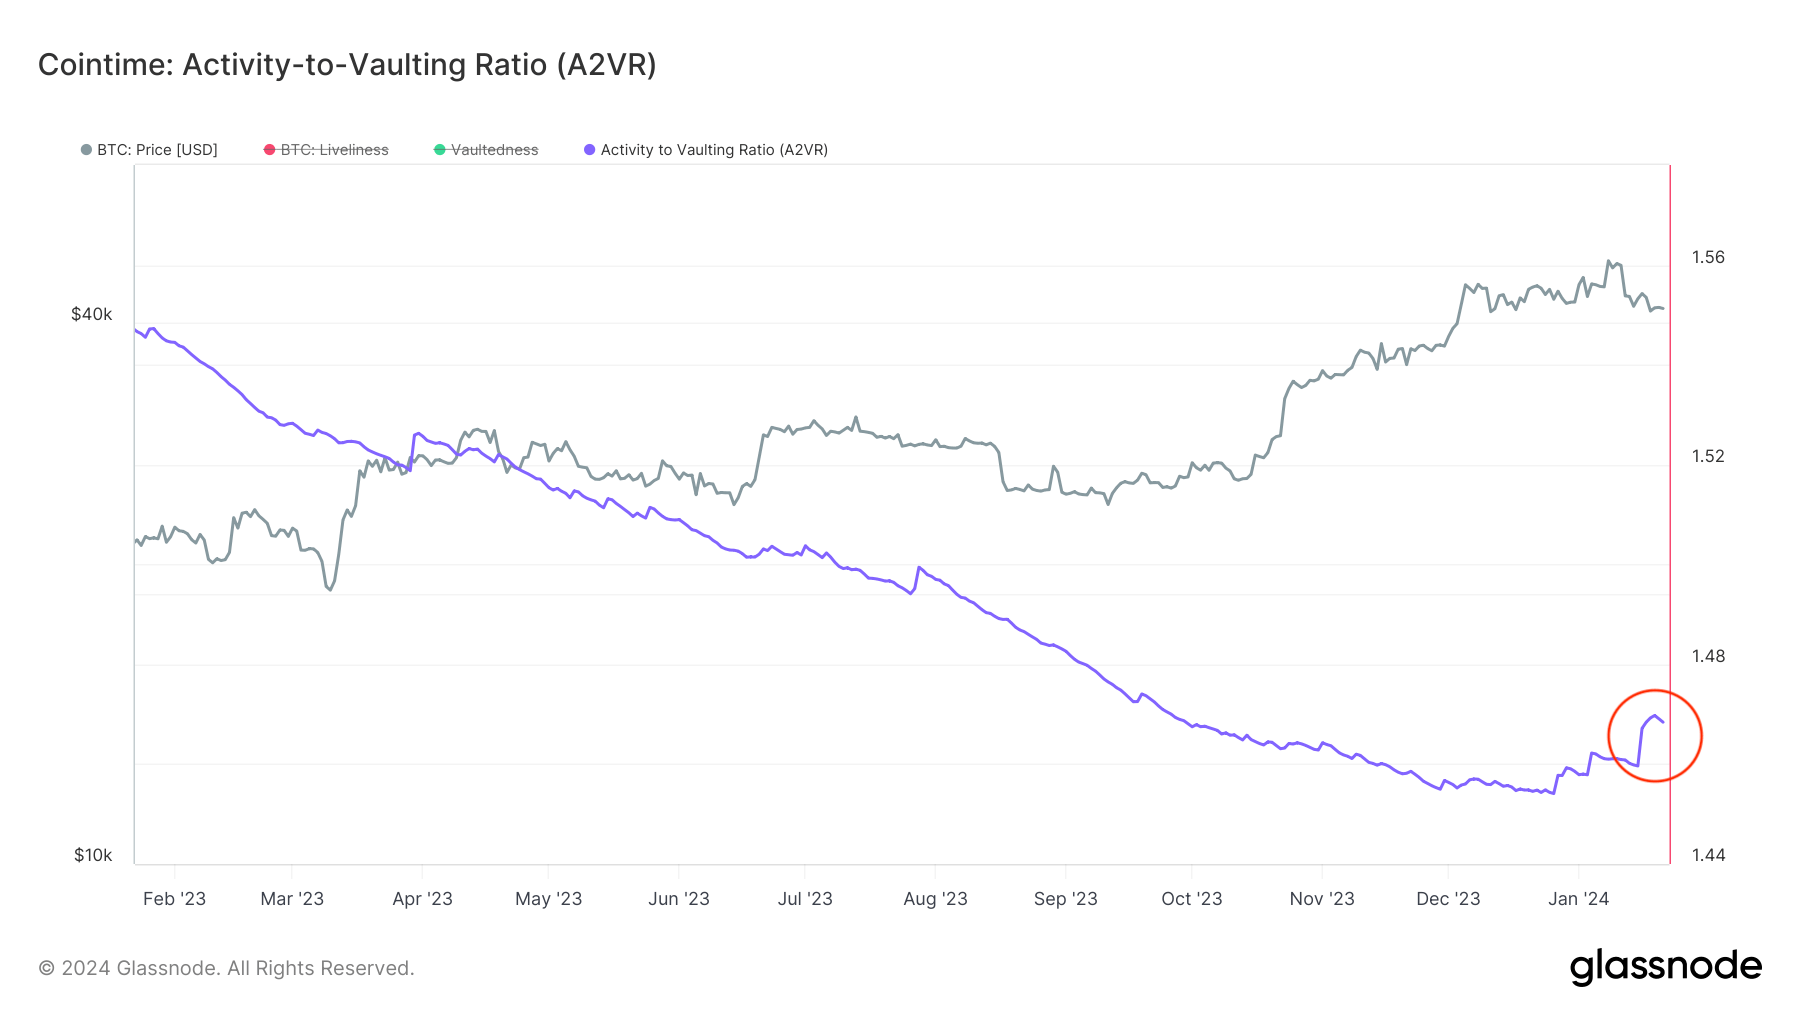
CryptoSlate’s analysis of on-chain metrics first brought on in Glassnode’s Cointime Economics research paper shows how this affected the activity-to-vaulting ratio (A2VR). The A2VR metric assesses the balance between Bitcoin’s active and inactive supply by comparing liveliness with vaultedness. It provides insight into the behavior of Bitcoin holders, indicating whether the trend is towards holding or trading the asset.
The yearlong downtrend in A2VR was broken in late December last year.

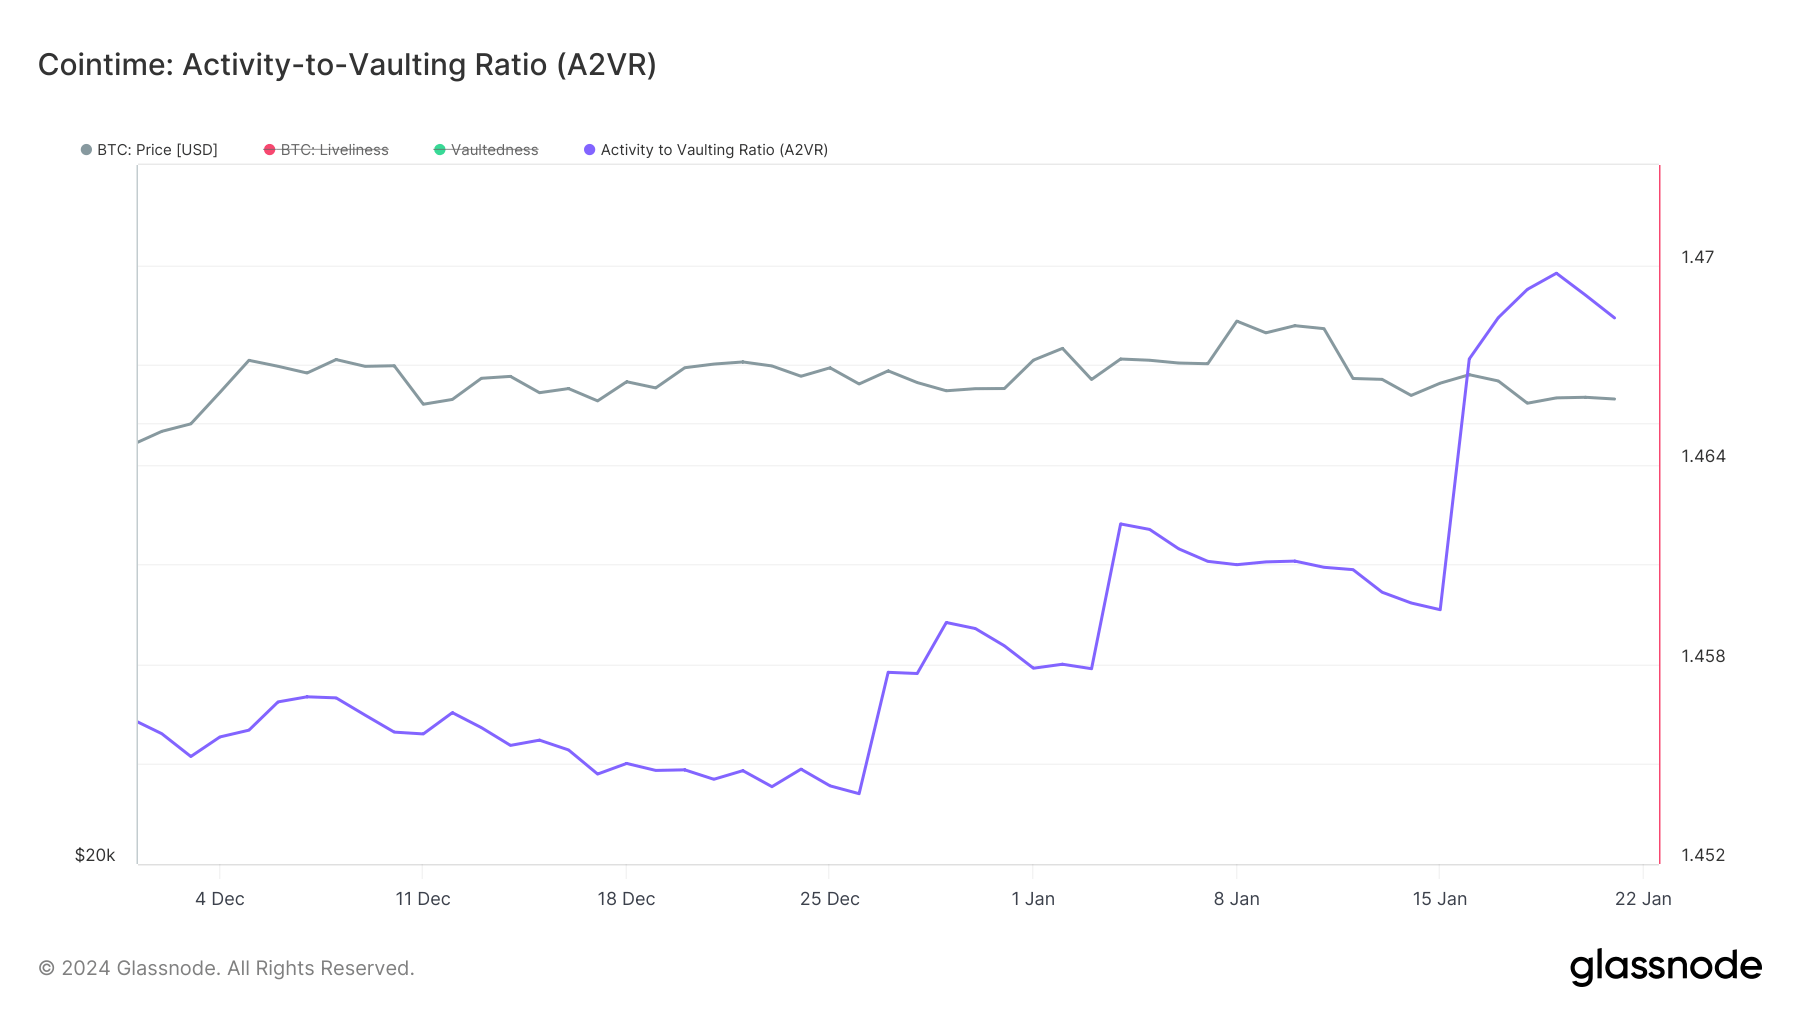
Between Dec. 26, 2023, and Jan. 19, 2024, there was a notable increase in A2VR from 1.4541 to 1.4697. This shift from holding to increased trading or liquidation of older coins was likely influenced by the market’s anticipation and subsequent reaction to the volatility introduced by the launch of spot Bitcoin ETFs in the U.S.
The decrease in Bitcoin price post-ETF launch and the uptrend in A2VR suggest a short-term bearish sentiment. Yet, the recent increases in A2VR hint at a shift towards more active trading, with the steepness of the uptrends post-ETF launch indicating potential for further market volatility.

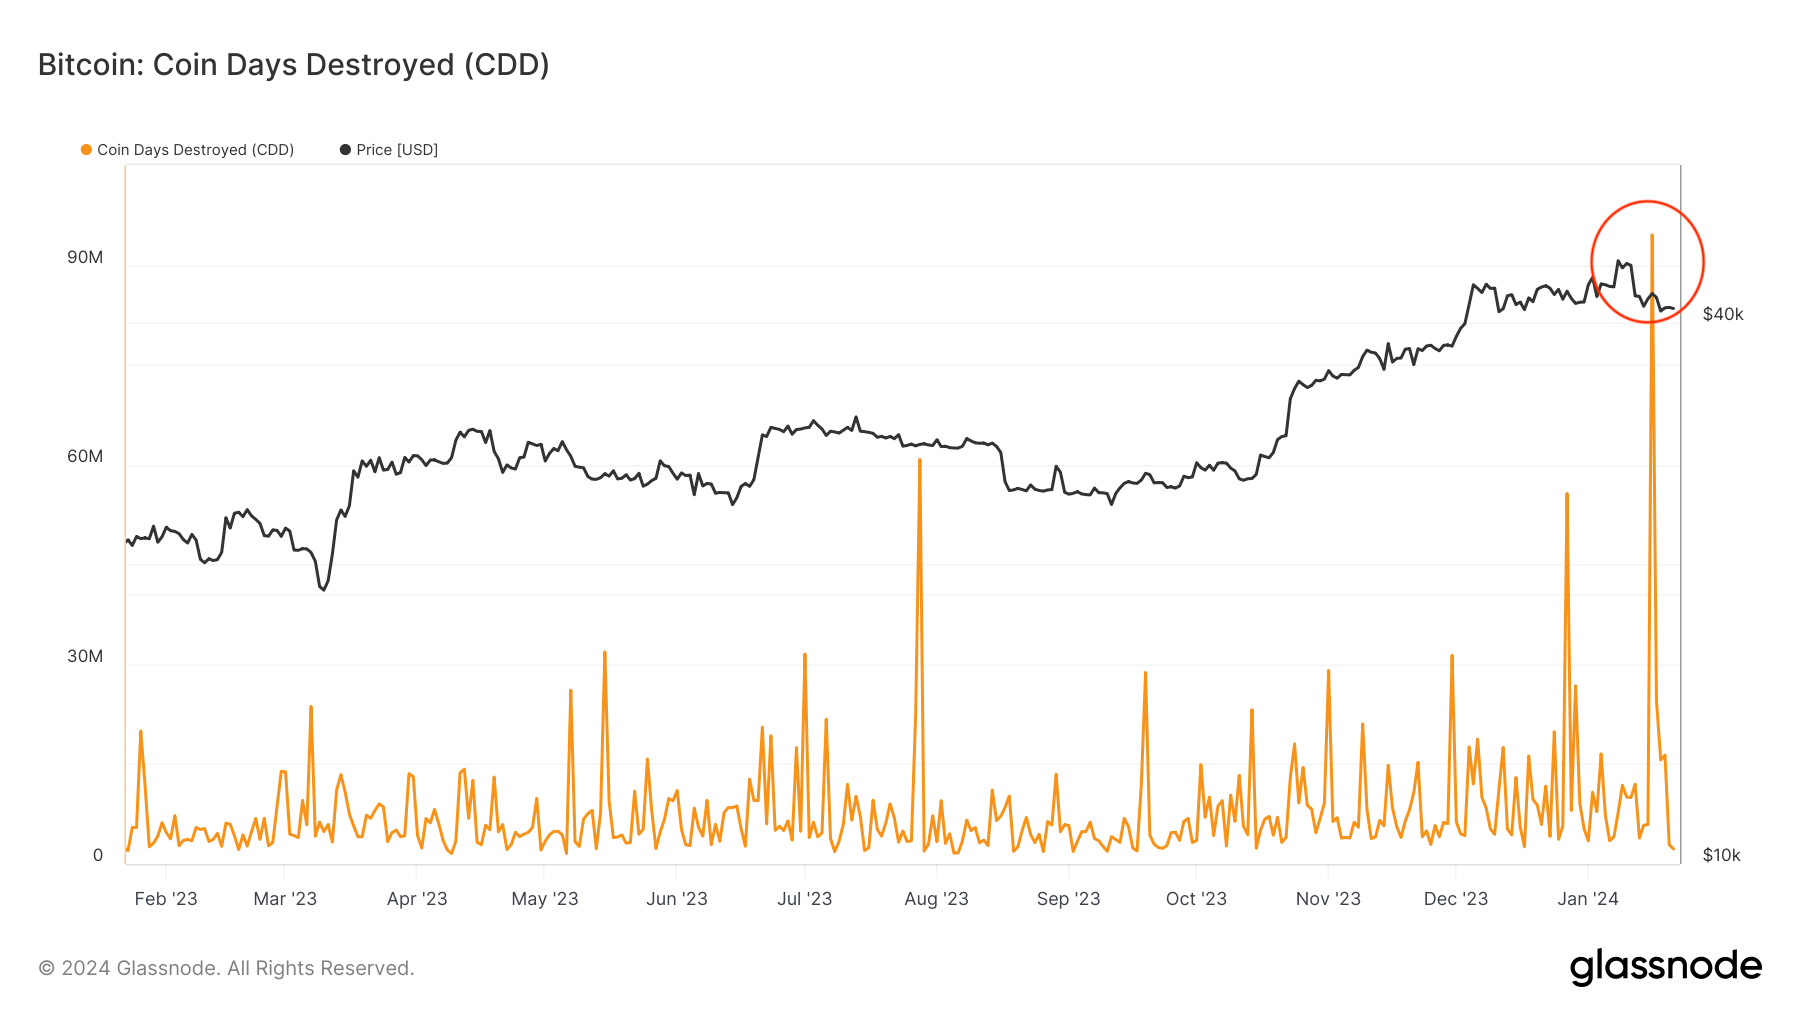
Coin Days Destroyed (CDD) is another advanced metric from Cointime Economics that provides more context for A2VR. CDD measures the sum of Bitcoin transaction volumes multiplied by the number of days since those coins were last spent.
A high CDD value indicates that large amounts of old Bitcoins are moving, which often signifies long-term holders transferring or selling their holdings. Between Jan. 14 and Jan. 15, CDD increased dramatically from 5.91 million to 94.5 million, reaching the highest level since February 2022. This significant movement of older, previously dormant Bitcoins aligns with an uptrend in A2VR, signaling a shift from inactivity to activity in the market.

High CDD values during a period of increasing A2VR suggest that long-term holders, previously contributing to inactivity, are transitioning towards more active trading. This can be a critical indicator of market sentiment, reflecting the behavior of typically more conservative investors.
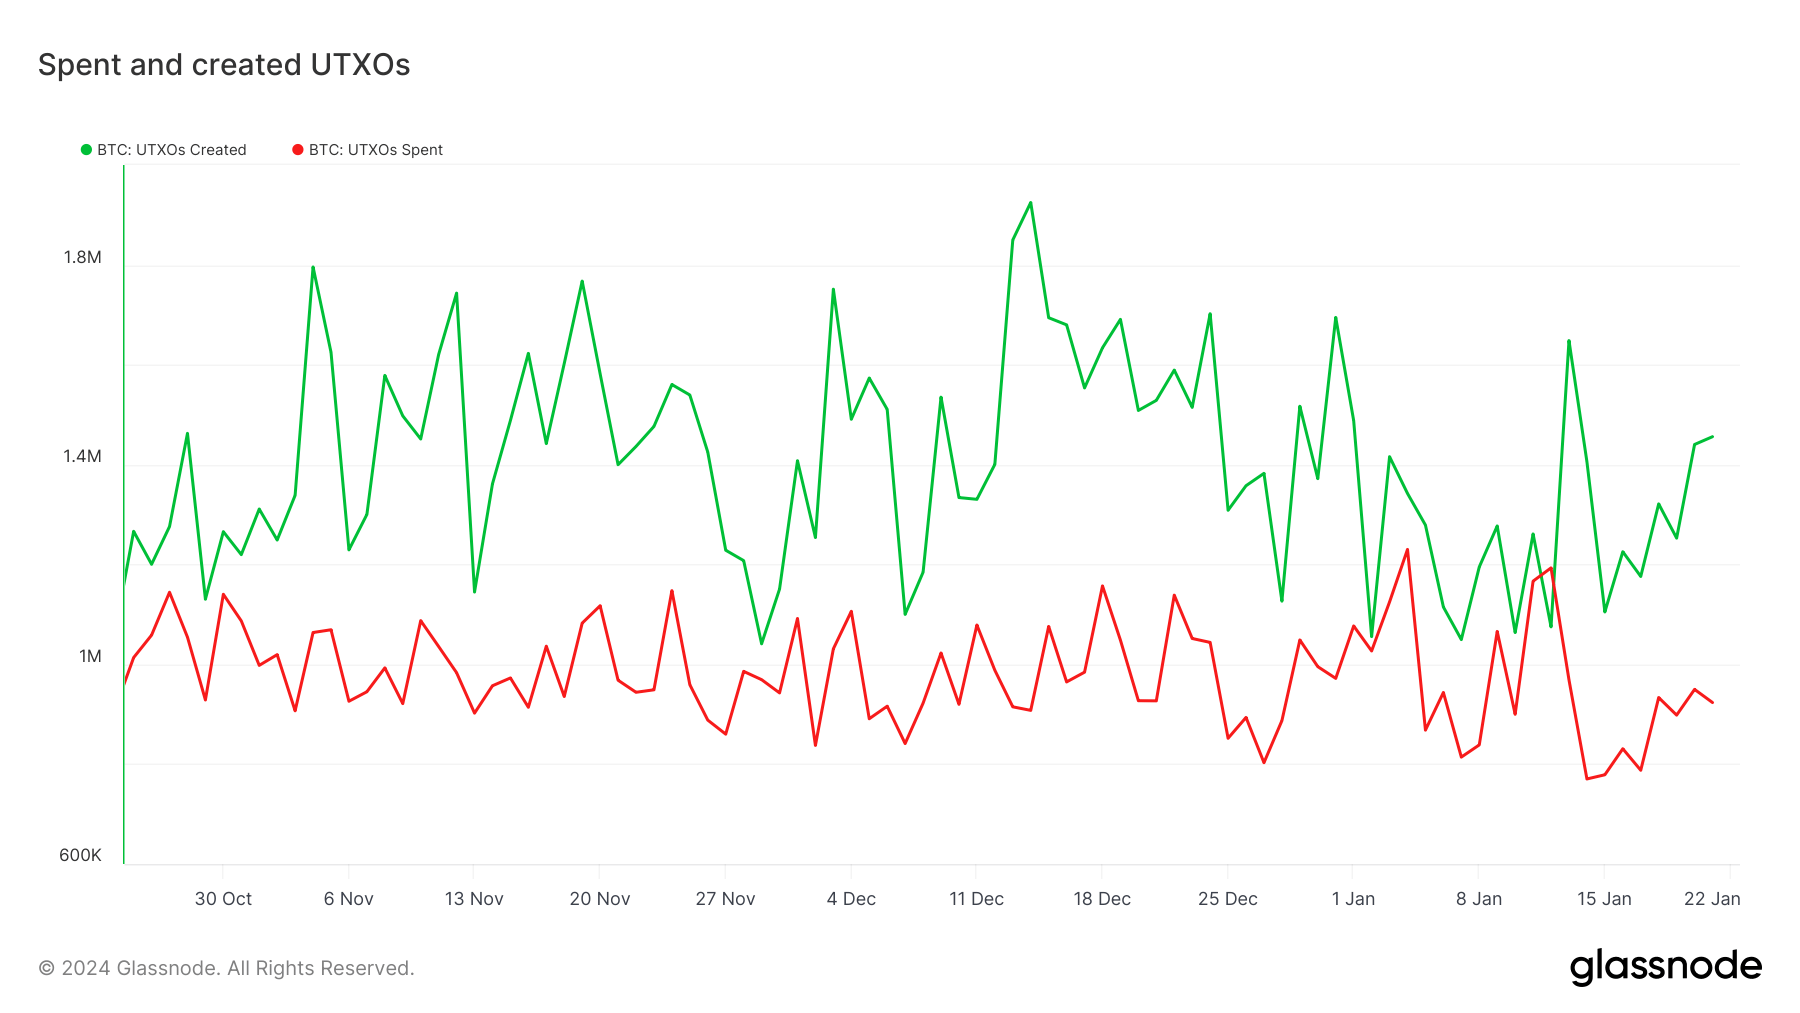
Despite these changes, there hasn’t been a significant increase in exchange flows or in the number of spent and created UTXOs. This suggests that while older Bitcoins are being moved, these movements are not translating into a widespread increase in transactional volume. This could occur if large, old transactions are executed, destroying many coin days without creating a corresponding surge in transactional activity.

The discrepancies between CDD, A2VR, and other metrics like exchange flows and UTXOs are likely due to activities related to the issuance and trading of spot Bitcoin ETFs.
Authorized Participants (APs) are typically large financial institutions responsible for creating and redeeming shares of the ETF. When they acquire Bitcoin for ETFs, they usually do so through Over-The-Counter (OTC) desks to minimize market impact.
OTC transactions do not appear directly on public exchange data, thereby not affecting visible exchange inflows or outflows. However, these transactions still involve the movement of large amounts of Bitcoin, which can significantly contribute to Coin Days Destroyed if the Bitcoins acquired have been dormant for a long time.
APs acquiring Bitcoin through OTC desks for ETFs can significantly impact CDD without affecting exchange flows, as these transactions do not appear in public exchange data. Similarly, the transition of investments from GBTC to ETFs involves large, on-chain movements that impact CDD but may not significantly alter UTXO counts or exchange-based flow metrics.
Grayscale’s GBTC has been a popular institutional vehicle for Bitcoin exposure. With the launch of spot Bitcoin ETFs, GBTC saw massive outflows as many investors chose to move their investments from GBTC to these new ETFs due to lower fees. This transition could involve the sale or redemption of GBTC shares and the corresponding acquisition of ETF shares.
The movement from GBTC to ETFs could lead to on-chain transactions as Bitcoin holdings are reshuffled between various financial products. These movements, particularly if involving long-held BTC in Grayscale’s reserves, could contribute to increased CDD. However, since these transactions might be managed internally or through OTC trades, they wouldn’t necessarily lead to noticeable changes in UTXO counts or exchange-based flow metrics.
While ETFs’ creation and redemption mechanisms lack transparency, on-chain metrics like CDD and A2VR still offer insights into their effects and magnitude. Understanding these metrics is crucial for comprehending the market’s response to new financial products and the behavior of institutional and long-term investors.
The post Why is so much old and hodled Bitcoin on the move but UTXOs and exchanges remain unaffected? appeared first on CryptoSlate.
